Employment in sport – developments between 2020 and 2022
Employment in sport represents 1.5 million people in the EU, 0.8 % of total employment
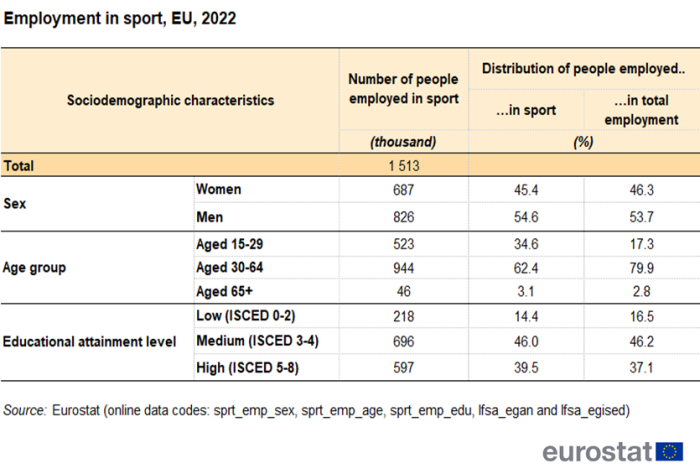
In 2022, 1.5 million people were employed in sport in the EU. Men (54.6 %) outnumbered women, resulting in a slightly narrower gender employment gap than that observed in total employment figures (see Table 1). Looking at employment by age, the majority of people employed in sport belonged to the age group 30-64 years. It is notable that the share of young people, aged 15-29 years employed in sport, was twice the share in total employment. This is in contrast to the age group of 30-64 years, whose share was 17.5 percentage points (pp) less than in total employment numbers.
Regarding the educational attainment level, 46 % of people employed in sport had a medium educational attainment level (International Standard Classification of Education (ISCED) levels 3-4), followed by 39.5 % with a high level (ISCED 5-8) and 14.4 % with a low level (at most ISCED level 2). These percentages are close to those observed for overall employment: around 2 pp less for low and 2 pp more for high educational attainment levels.
Important increase in sport employment in 2022 compared with 2021
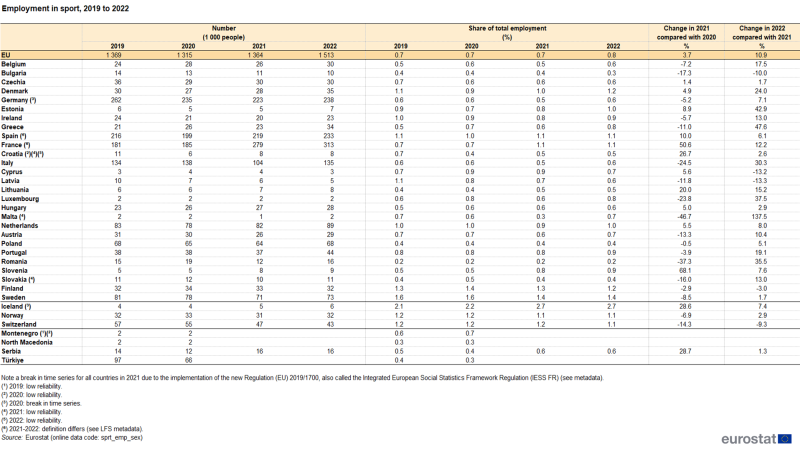
In 2022, the number of people employed in sport increased significantly, with around 150 000 more employees than in 2021 (up by 10.9 %), raising the proportion of people employed in sport in total employment figures to 0.8 %.
Source: Eurostat (sprt_emp_sex)
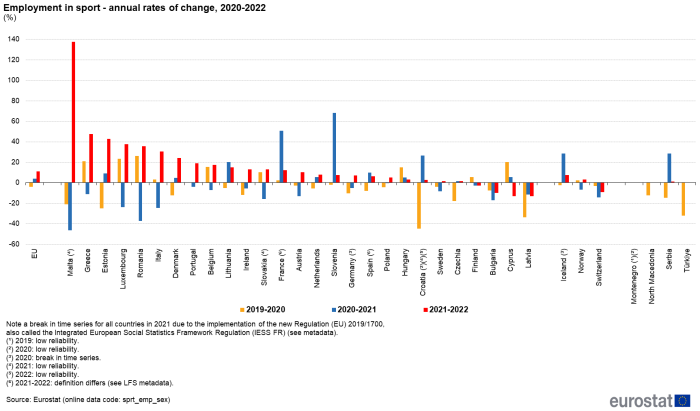
This increase can be seen in the context of the recovery from the Covid-19 crisis. The previous years from 2020 to 2021 were characterised by decreases in several countries due to the restrictions in place during the pandemic. From 2019 to 2020, employment in sport fell in 16 of the 27 EU Member States, with Croatia, Latvia, Estonia and Malta recording the largest decreases (more than -20 %). Of the 11 countries with a positive change, four (Romania, Luxembourg, Greece and Cyprus) were able to increase employment in sport by at least 20 %. In most of these countries, the number of people employed in sport is relatively low, meaning that even a small variation could lead to a large percentage increase or decrease (see Figure 1).
In 2022, the growth was particularly visible, with employment in sport rising in 23 EU Member States compared with 2021. Malta (+137.5 %), Greece (+47.6 %) and Estonia (+42.9 %) recorded the highest increases, while four countries still had a negative balance compared with 2021, namely Latvia (-13.3 %), Cyprus (-13.2 %), Bulgaria (-10 %) and Finland (-3 %).
(%)
Source: Eurostat (sprt_emp_sex)
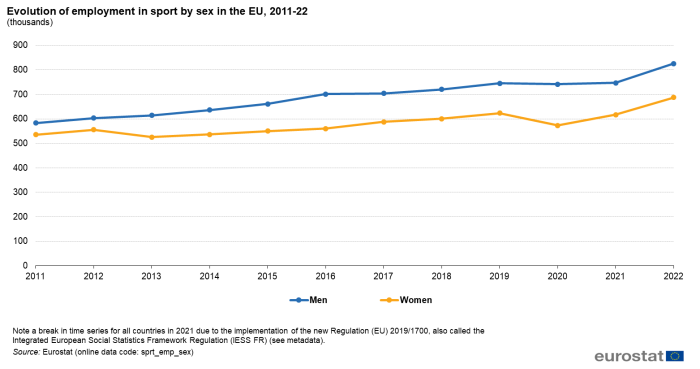
Since 2011, sex has been an indication of how the number of people employed in sport has developed (see Figure 2):
- In the last decade, men registered a steady trend, with an increasing number of men employed in sport every year, from 583 000 in 2011 to 745 000 in 2019, with a small drop of 3 500 in 2020, before increasing again in 2021 (+5 000) and more strongly in 2022 (+79 000, +10.6 %).
- On the other hand, the number of women employed in sport had already decreased in 2013 (-30 000 compared with 2012). Then, after a few years of continuous increase, bringing the number up to 624 000 in 2019, it dropped considerably in 2020 (-50 000, -8.1 %). In 2022, women employed in sport reached the highest level at 687 000 (+70 000, +11.3 % compared with 2021).
Source: Eurostat (sprt_emp_sex)
Characteristics of employment in sport in 2022
Employment in sport as a share of total employment
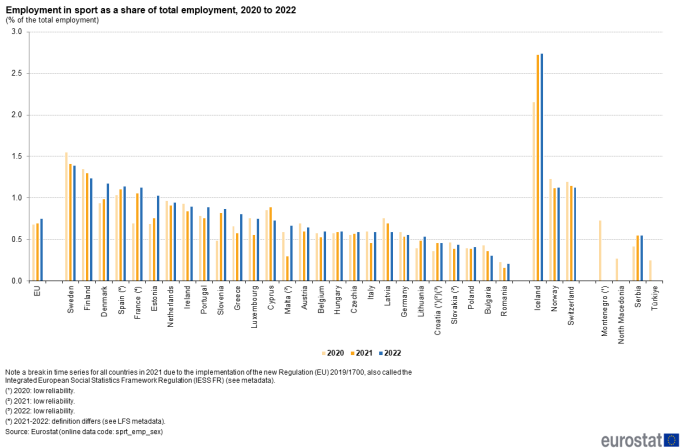
In 2022, employment in sport represented 0.8 % of total EU employment, ranging from 0.2 % in Romania to 1.4 % in Sweden (see Figure 3). In Sweden, Finland, Denmark, Spain, France, Estonia and the Netherlands, employment in sport accounted for at least 1 % of total employment. At country level, the contribution of employment in sport to total employment increased in 14 of the 27 EU Member States during the 2020-2022 period.
(% of total employment)
Source: Eurostat (sprt_emp_sex)
Men outnumber women in employment in sport
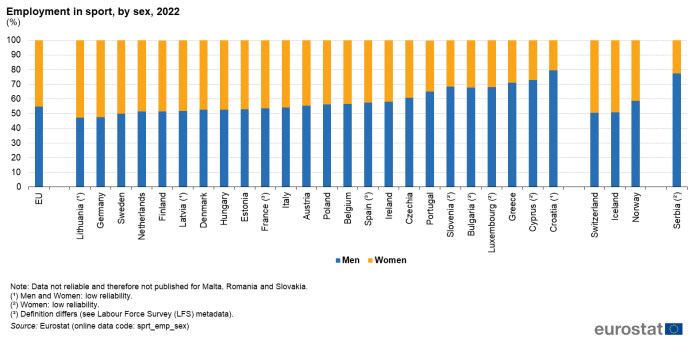
In 2022, men accounted for 54.7 % of people employed in sport in the EU (see Figure 4), reflecting the structure of the total employed population. In most EU Member States, fewer women than men were employed in sport, with the greatest gender employment gaps (with at least two-thirds of people employed in sport being men) observed in Croatia (79.5 % of men), Cyprus (72.7 %), Greece (71 %), Luxembourg (68.2 %), Bulgaria (67.7 %) and Slovenia (67.4 %). On the other hand, more women than men were employed in sport in Lithuania (52.6 % of women) and Germany (52.4 %).
Almost 35 % of people employed in sport are aged 15-29 years
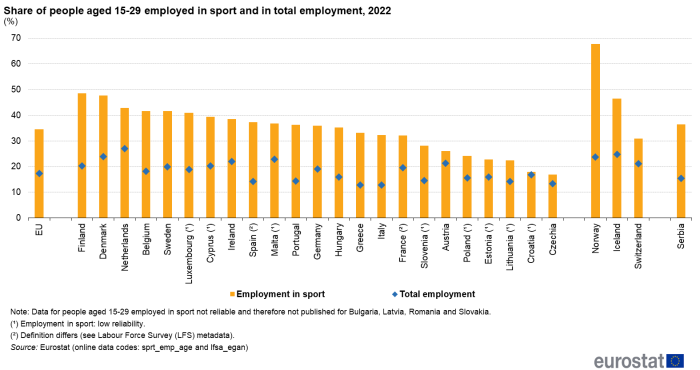
Compared with the age structure of the total employed population (see Figure 5), young people accounted for a relatively large share of people employed in sport: in 2022, more than one-third of people employed in sport in the EU were aged 15-29 years. This is twice as much as in total employment (17.3 %). In all countries for which data are available, the proportion of young people employed in sport outnumbered the proportion recorded in total employment. The difference was particularly significant in Spain and Greece, where the percentage of young people employed in sport was 2.6 times higher than in total employment. This was also the case for Portugal and Italy (2.5 times higher) and Finland (2.4 times higher).
Six EU Member States recorded at least 40 % of people employed in sport as being young people: Finland (48.6 %), Denmark (47.7 %), the Netherlands (42.9 %), Belgium, Sweden (both 41.7 %) and Luxembourg (40.9 %). At the other end of the spectrum, only seven countries had less than 30 % of people employed in sport as being aged 15-29 years, with the lowest percentage observed in Czechia (16.8 %).
(%)
Source: Eurostat (sprt_emp_age) and (lfsa_egan)
39.5 % of people employed in sport have completed tertiary education
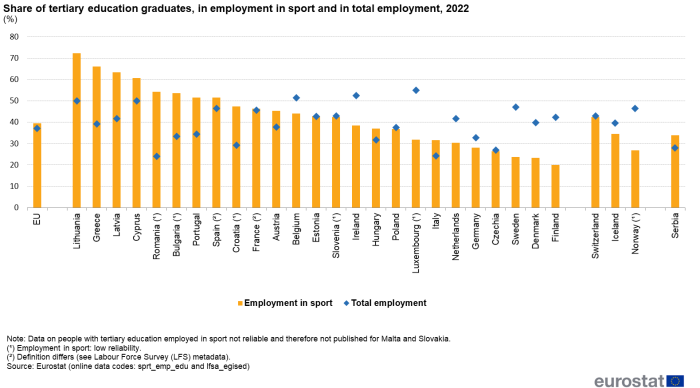
In terms of the educational background of people employed in sport in the EU in 2022, 39.5 % had completed tertiary education (see Figure 6). This figure was slightly higher than the proportion of tertiary education graduates in total employment (37.1 %). In two EU Member States, at least two-thirds of people working in sport were tertiary education graduates – Lithuania (72.4 %) and Greece (66 %); in another six EU Member States, this share was over 50 %. Of the 25 EU Member States with reliable data, 11 registered a proportion of tertiary education graduates employed in sport below the EU average of 39.5 %, with the lowest percentages observed in Denmark (23.4 %) and Finland (19.9 %).
In 2022, Romania had the highest proportion of tertiary education graduates employed in sport compared with total employment figures (with a ratio of 2.3), followed by Greece (1.7). On the other hand, in 11 EU Member States, the proportion of tertiary education graduates in employment in sport was lower than in total employment.
(%)
Source: Eurostat (sprt_emp_edu) and (lfsa_egised)
Focus on young and tertiary educated people
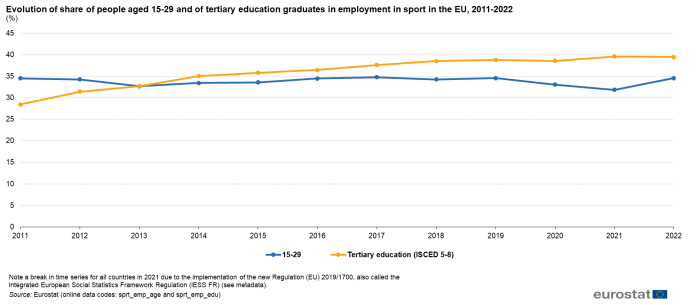
The proportion of young people employed in sport rose again in 2022 following a decline, while the proportion of tertiary education graduates stabilised in 2022 following a steady increase
Regarding the evolution throughout the period from 2011 to 2022 for the two sociodemographic characteristics analysed in the previous paragraphs (age group 15-29 and tertiary education), different trends can be seen (see Figure 7):
- The share of young people employed in sport decreased from 2011 to 2013 by 1.8 pp, before increasing again to almost 35 % in 2017. It then dropped significantly from 2019 to 2021 (-2.6 pp). In 2022, it reached 34.6 % of all people employed in sport.
- Conversely, the share of tertiary education graduates employed in sport increased every year from 2011 to 2021 (except 2020), rising from 28.5 % in 2011 to 39.6 % in 2021 before stabilising in 2022 (-0.1 pp).
(%)
Source: Eurostat (sprt_emp_age) and (sprt_emp_edu)
Source data for tables and graphs
Data sources
As there is no Eurostat data collection specifically for sport, sport statistics are derived from existing EU data collections. Employment statistics related to sport are extracted from the results of the European Union Labour Force Survey (EU-LFS) — the main source of information for the EU labour market and employment trends.
The purpose of these statistics is to highlight the contribution sport makes to overall employment, and the main characteristics of employment in sport (using variables such as age, sex or educational attainment).
Methodology/Metadata
Employment in sport is measured using the central statistical definition from the Vilnius definition of sport, covering the core sporting activities under NACE Rev.2 group 93.1 — Sports activities.
The variable occupation has also been introduced as part of the scope of employment in sport: all jobs in a NACE economic sector and jobs in a sports occupation (ISCO, ‘International Standard Classification of Occupations’) outside the NACE sport sector are considered simultaneously. In practice, this means that all workers recorded in NACE Rev.2 group 93.1 (Sports activities) and/or ISCO-08 code 342 (Sports and fitness workers) fall within the scope of this definition of sport. In other words, employment in sport includes the working population employed:
- in a sports-related occupation in the sports sector (ISCO-08 code 342*NACE Rev.2 group 93.1), e.g. professional athletes, professional coaches in fitness centres, etc.;
- in a non-sports occupation in the sports sector (NACE Rev.2 group 93.1), e.g. receptionists in fitness centres;
- in a sports-related job (ISCO-08 code 342) outside the sports sector, e.g. school sport instructors.
NACE Rev.2 group 93.1 includes:
- the activities of sports teams or clubs whose primary activity is participating in live sports events before a paying audience;
- independent athletes who take part in live sporting or racing events before a paying audience;
- owners of vehicles or animals that take part in races (such as cars, dogs or horses) who are primarily engaged in entering them in racing or other spectator sports events;
- sports trainers providing specialised services to support participants in sporting events or competitions;
- operators of arenas and stadiums;
- other activities of organising, promoting or managing sports events, not elsewhere classified.
ISCO-08 code 342 includes sports and fitness workers (athletes, players, coaches, instructors and officials, fitness and recreation instructors and programme leaders).
It is important to bear in mind that the employment figures presented here are person counts, not full-time equivalents. In other words, they include all paid workers in sport-related jobs, regardless of their work pattern (full-time or part-time). The EU-LFS collects detailed information on the economic activity and occupation only of the respondent’s main job and therefore omits information pertaining to secondary jobs. As such, these secondary jobs are excluded from the aggregate covering employment in sport. In view of these aspects and the approach adopted, the data are likely to underestimate the true extent of employment in this field.
Time series
Regulation (EU) 2019/1700 came into force on 1 January 2021 and resulted in a break in the EU-LFS time series for several EU Member States. To monitor the evolution of employment and unemployment despite the break in the time series, Member States assessed the impact of the break in their country and computed impact factors or break corrected data for a set of indicators. Break corrected data are published for the LFS main indicators.
More information on the EU-LFS can be found via the online publication EU-LFS, which includes eight articles on the technical and methodological aspects of the survey. The EU-LFS methodology in force from the 2021 data collection onwards is described in methodology from 2021 onwards. Detailed information on coding lists, explanatory notes and classifications used over time can be found under documentation.
Context
The multiannual work programmes (EU Work Plan for Sport for 2014-2017; EU Work Plan for Sport for 2017-2020; EU Work plan for Sport for 2021-2024) are a tangible example of the increasing importance of sport in European policy initiatives. These programmes, agreed by the Council, set the priorities and the principles for cooperation between the European Commission and Member States in the field of sport.
Several expert groups have been set up to achieve concrete results. Among them, the Expert Group on the Economic Dimension of Sport (XG ECO) and the Expert Group on Health-Enhancing Physical Activity (XG HEPA) play a key role in implementing evidence-based policies in the sports sector. XG ECO, for example, has developed an economic definition of sport (‘Vilnius definition‘), and made progress towards developing Sport Satellite Accounts in some EU Member States. XG HEPA is working on implementing the Council recommendations on physical activity adopted in 2013. These include a monitoring framework with indicators both for the level of physical activity and for policies to promote physical activity in EU Member States.
Eurostat comparable data on employment in sport, international trade, participation in sporting activities, etc. make a valuable contribution to the monitoring and development of the EU’s policies in this area.

