How is the preliminary flash produced?
In brief, a majority of EU Member States transmit their employment growth estimates to Eurostat one day before the agreed publication date. This group includes those Member States already publishing early estimates as well as a number of Member States that transmit confidential estimates to Eurostat. Eurostat then uses countries’ data to compile EU and euro area growth rates by weighing them with countries’ annual employment. The aggregation is performed on seasonally adjusted series for quarter-on-quarter growth rates and on unadjusted series for year-on-year growth rates.
The decision to start publishing the EA/EU Employment flash t+45 estimates is based upon the results of test estimates carried out after 30 and 45 days by a Eurostat task force in 2017 and 2018 based on agreed criteria. This included back estimates so that the period 2015Q1 to 2018Q1 was covered. In the last test estimates for the quarter 2018Q1, the country coverage for the t+45 estimates reached 91 % of the EU-28 GDP and 95 % of the EA-19 GDP. For the t+30 estimates country coverage remained under the 75% acceptance target.
The conclusion is that the release of employment flash estimates for the euro area and the European Union after 45 days can start in mid-November 2018. Testing to advance the estimates further to 30 days will continue.
Is the preliminary estimate reliable?
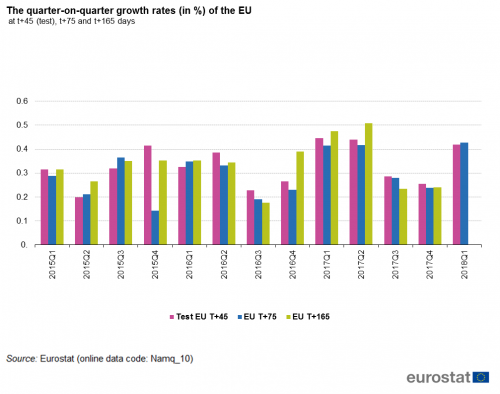
As flash estimates are available earlier than the traditional estimates, there is a trade-off between timeliness and accuracy. Based on the 13 test estimates, the revision at t+75 for the employment quarter-on-quarter growth rates published at t+45 was between –0.03 and +0.05 percentage points for the euro area (average revision 0.00 pp) and between –0.05 and +0.05 percentage points for the EU (average revision -0.03 pp). In the case of a sudden dramatic change in the economic development, as in the second quarter of 2008 with the financial crisis, larger revisions than these may be expected.
The expected revisions have been tested against predefined quality criteria and passed these tests. Figure 1 shows the differences in the quarter-on-quarter growth rates at t+45 (test estimates), at t+75 and at t+165 days for 2015Q1–2018Q1 for the euro area and Figure 2 for the EU.
Source: Eurostat (namaq_10)

Source: Eurostat (namaq_10)

