Quarterly changes
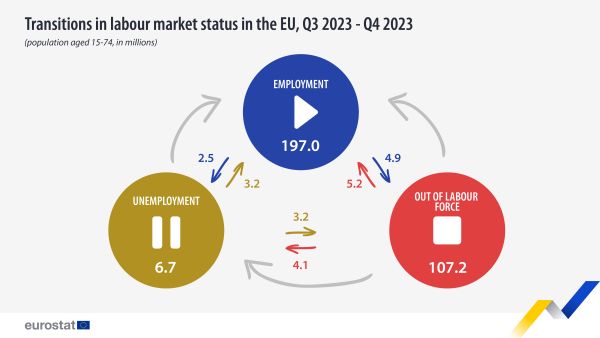
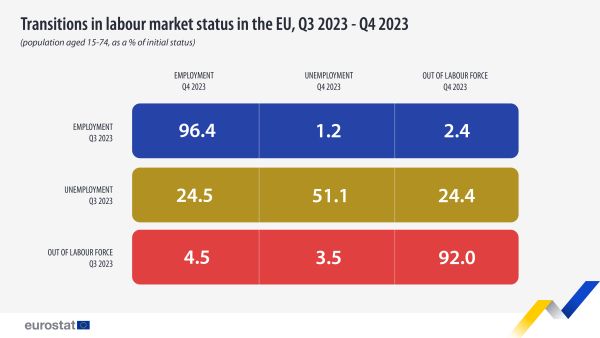
Of all unemployed persons in the European Union (EU) in the third quarter of 2023, 51.1 % (6.7 million) were still unemployed in the fourth quarter of 2023, while 24.5 % (3.2 million) moved into employment and 24.4 % (3.2 million) left the labour force. Of all those initially in employment, 96.4 % (197 million) remained in employment, while 1.2 % (2.5 million) were recorded as unemployed in the fourth quarter of 2023, and 2.4 % (4.9 million) transitioned out of the labour force. Of all those who were outside the labour force in the third quarter of 2023, 92 % (107.2 million persons) remained there in the fourth quarter of 2023, while 4.5 % (5.2 million) moved into employment and 3.5 % (4.1 million) became unemployed. Figure 1 gives an overview of all possible transitions and shows the aggregate transitions between Q3-2023 and Q4-2023 between the different labour market statuses. Data is shown in absolute numbers to allow a comparison of the actual size of the different flows. The levels indicated for employment, unemployment and outside the labour force refer to those remaining in each status between the two quarters. The grey arrows indicate the net direction of flows between two statuses. Table 1 shows the same flows as a percentage of the initial labour market status, to give an impression of the share of individuals leaving each labour market status. All quarterly data shown are seasonally adjusted.
Source: Eurostat (lfsi_long_q)
Source: Eurostat (lfsi_long_q)
Three quarterly transitions: unemployment to employment, unemployment to out of the labour force (formerly: inactivity) and employment to out of the labour force (formerly: inactivity), are included in the European Statistical Recovery Dashboard, see here.
Annual changes
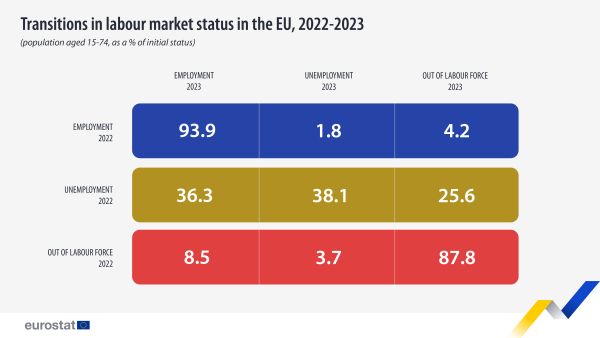
Of all those persons in the European Union (EU) who were unemployed in 2022, 38.1 % remained unemployed in 2023, while 36.3 % moved into employment and 25.6 % left the labour force. Of all those initially in employment, 93.9 % remained in employment, while 1.8 % of those employed in 2022 were recorded as unemployed in 2023, and 4.2 % transitioned out of the labour force. Table 2 shows all transitions as a percentage from the initial labour market status.
Source: Eurostat (lfsi_long_a), data extracted in March 2024
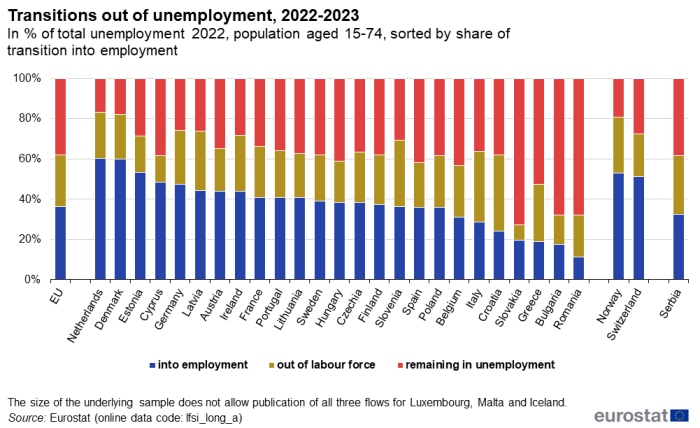
Figure 2 shows data at country level. To allow comparison, the focus is on outflows of unemployment from 2022 to 2023. Outflows from unemployment into employment were at least 50 % only in the Netherlands, Denmark and Estonia. In Slovakia, Greece, Bulgaria and Romania less than 20 % of those who were unemployed in 2022 found a job in 2023. Transitions from unemployment to out of the labour force were particularly high in Croatia (37.8 %) and also exceeded 30 % in Italy and Slovenia.
Source: Eurostat (lfsi_long_a), data extracted in March 2024
Labour market flows: transition probabilities
Percentage of labour market flows: understanding transition probabilities
Flows can be expressed in levels, as a percentage of the initial status, or as a percentage of the final status. In this article and in the labour market flows database, Eurostat expresses flows in levels and as a percentage of initial status. This means that flows in percentage always refer to outflows from the initial status towards the final status. Mathematically speaking, each flow is calculated as the relevant outflow divided by the sum of all outflows from the same status. These figures can also be referred to as transition probabilities: given that an individual is in a certain labour market status in the initial period, the outflows expressed in percentage refer to the probability, all else equal, that the individual will be in a certain labour market status in the final period.
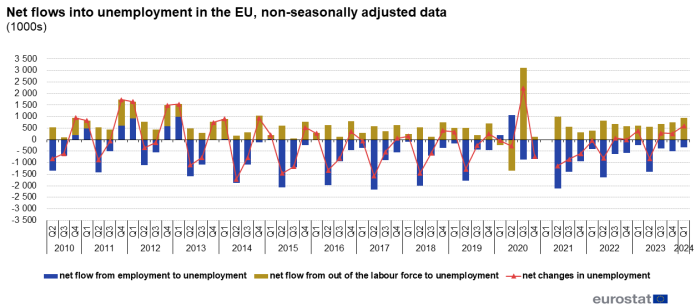
Flow statistics augment the analysis of the net changes in stocks of unemployment, employment and persons outside the labour force. To illustrate this point, Figure 3 shows the evolution of net changes in unemployment each quarter since Q2-2010 and how this change is composed. From 2021 onwards, labour market flows cover the whole EU; data up to 2020 contain estimates for Germany that are not published. The darker bars illustrate the net flow between employment and unemployment, while the lighter bars illustrate the net flows between those outside the labour force and unemployment. Negative values indicate net flows out of unemployment, which means unemployment decreases. On the other hand, positive values show net flows into unemployment, reflecting rising unemployment. A darker bar with a negative value therefore indicates a net flow from unemployment into employment while a positive value indicates a net flow from employment into unemployment. The same holds for the interpretation of the flow from outside the labour force indicated by the lighter bars. The line traces the net change in unemployment levels resulting from the combined net flows. For net flows between two quarters, if the lighter and darker columns are both positive or both negative, then the corresponding triangle represents the sum of both bars. If one bar is positive (inflow into unemployment) and the other is negative (outflow from unemployment), then the triangle indicates the net effect of these two flows.
(thousand persons)
Source: Eurostat (lfsi_long_q), data extracted in March 2024
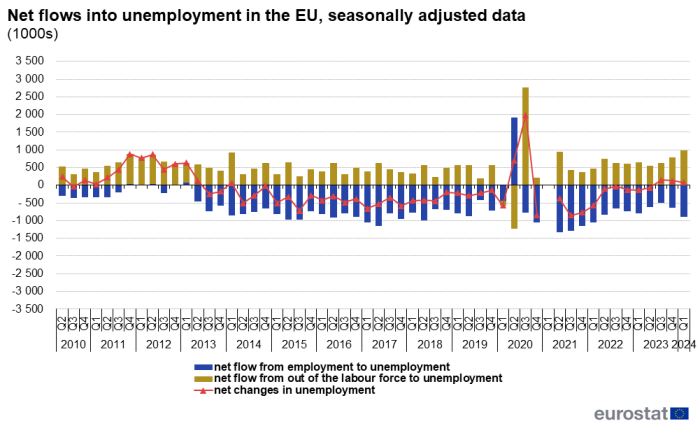
Figure 4 shows the same information using seasonally adjusted data. Figure 3 reveals that the flows are highly seasonal, which means that the size and direction of a flow in and out of unemployment depends not only on general economic conditions, but also on seasonal factors that are repeated in a similar fashion each year. These seasonal factors have been removed from the data (seasonally adjusted data) in Figure 4 and it becomes clear that the net changes in unemployment peak at the end of 2011. This means that inflows into unemployment were largest (or outflows from unemployment were the least) during that period. From 2012 onwards, the net changes in unemployment decreased significantly, indicating a decreasing inflow into unemployment or an increasing outflow from unemployment. From 2014 onwards, net outflows of unemployment exceeded inflows in almost all quarters until 2020. Starting with Q2-2020, the impact of the COVID-19 crisis becomes clearly visible. As a result, the inflows into unemployment reached a historic high in Q3-2020.
For the quarters 2020Q4 to 2021Q1, no estimates are available due to a break in the time-series of the European Union Labour Force Survey (EU-LFS) following updated labour status definitions in 2021. These updated definitions are part of European statistics relating to persons and households, based on data at individual level collected from samples (Regulation (EU) 2019/1700) and Implementing Regulation (EU) 2019/2240 for the labour market domain and entered into force in 2021.
Between Q2-2021 and Q2-2022, the outflows of unemployment outweighed the inflows, resulting in a negative net effect on unemployment in the EU for that period. In Q3-2022, the flows into unemployment were somewhat higher than the outflows, representing a positive net effect on unemployment. Between Q4-2022 and Q2-2023 the net effect on unemployment stayed negative, while in Q3-2023 and Q4-2023 the flows into unemployment recorded higher levels than the outflows.
(thousand persons)
Source: Eurostat (lfsi_long_q), data extracted in March 2024
Feedback
To help Eurostat improve these experimental statistics, users and researchers are kindly invited to give us their feedback by email
Data sources
Methodology
The data in this article are subject to revisions due to improvements in the methods used to derive flow estimates. However, the statistics are deemed reliable for policy analysis and other purposes. The methodology applied aims at producing comparable figures across countries and may differ from national approaches. For an up-to-date list of countries that send their national estimates to Eurostat for publication, please see the metadata file linked to the data table. Estimates are derived from the EU-LFS by exploiting the quarterly and annual overlap of a share of the sample; this overlapping data is weighted to be compatible with stock data derived from the EU-LFS for the initial period as well as the target period, with the exception of those outside the labour force in the initial period. Since the EU-LFS is not designed as a panel survey, attrition between periods, particularly for year-on-year flows, is relatively high. Persons who move nationally, internationally, cannot be contacted, refuse to answer or die are missing from the pseudo-longitudinal sample. For the production of flow estimates, the relatively strong assumption has to be made that those who drop out are similar in their labour market transition behaviour to those who stay in the sample.
Eurostat calculates initial flow estimates as 3×3 International Labour organisation (ILO) labour status transition matrices, for the age group 15-74 years, by sex and for individual countries.
For the transition from 2020 to 2021, no estimates are available due to a break in the time-series of the European Union Labour Force Survey (EU-LFS) following updated labour status definitions in 2021. These updated definitions are part of European statistics relating to persons and households, based on data at individual level collected from samples (Regulation (EU) 2019/1700) and Implementing Regulation (EU) 2019/2240 for the labour market domain and entered into force in 2021.
The following general criteria are applied for quarter-on-quarter as well as year-on-year flow calculations:
- For all quarters from Q2-2010 onwards, the quarterly longitudinal flow samples are defined as the overlap of one quarterly sample with the sample of the previous quarter for the age group 15-74 years. For all years from 2011 on, the annual longitudinal flow samples are defined as the overlap of all four quarters of one year with the same quarters of the previous year for the age group 15-74 years.
- All computations are restricted to persons aged 15-74 years during the target period; this implies that in the initial period, persons aged 14 years are included in the sample as well.
Labour status transitions – computational details
The current calculation of ILO labour status transitions already anticipates possible future consistency requirements for flow statistics. For each transition, i.e. from an initial period to the target period, it starts with separate calculations by sex and age group, using 10-year age groups: 15-24 years, 25-34 … 65-74 years. For each of these subgroups, the ILO labour status distribution in the longitudinal flow sample is calculated, using target period weights. As those figures are based on a subset of the target sample only, the resulting grossed-up weights do not provide correct estimates for the underlying population subgroups. They therefore need to be calibrated further to known marginal totals for the subgroups in question. To do this, the target period distribution of the three labour statuses in the respective subgroups is taken and correction factors calculated.
The flow sample weights are then adapted to match the distribution in the target period, namely for each age group x sex x labour status. The steps described below could be applied to each individual matrix produced this way. However, to avoid empty or poorly populated cells as far as possible and to get more robust results, calculation of the headline indicators for the age group 15-74 years starts with a further aggregation of the previous results over age, i.e. all intermediate transition matrix results calculated so far for an individual country are combined into one single matrix, by sex. As they are simply added up, these combined matrices also match the relevant ILO labour status distribution in the target period, by sex.
As for the target period, marginal ILO labour status distributions for the initial period are also available. The next step tries to achieve consistency of the transition matrix with both marginal distributions. The procedure applied requires a common population aged 15-74 in both periods – for that, the likely least critical value (population outside the labour force in initial period) is corrected in a way that the total population in both periods matches that of the final period. While in the majority of countries, the total population changes very little between years for the time period for which data is produced, there are some countries with larger population changes; for these countries, flow estimates might be affected by this choice of methodology. An iterative raking procedure is then applied. It starts with the matrix consistent with the final period distribution and tries to find matrix values that are as close as possible to the start matrix while also ensuring consistency to the (partly corrected) initial period distribution. The procedure implies an alternating adjustment of the matrix rows and columns. The iterative raking stops once the row and column sums deviate from the marginal distributions less than a pre-specified threshold. The results of the iterative raking are the flow estimates to be used for publication by Eurostat. They are published separately for males and females.
Breakdowns of labour market flow statistics
While transitions between the ILO labour statuses are interesting and important indicators in their own right, there is nevertheless demand from policy makers, researchers and other stakeholders for breakdowns of these flows. It is not only important to know how many unemployed persons manage to find a job and move towards employment, but also which of the unemployed manage this transition. A large number of other breakdowns for the transition between unemployment and employment are of interest and the same holds for other transitions, such as transitions between inactivity and employment and transitions between contracts for those who are employed and stay employed.
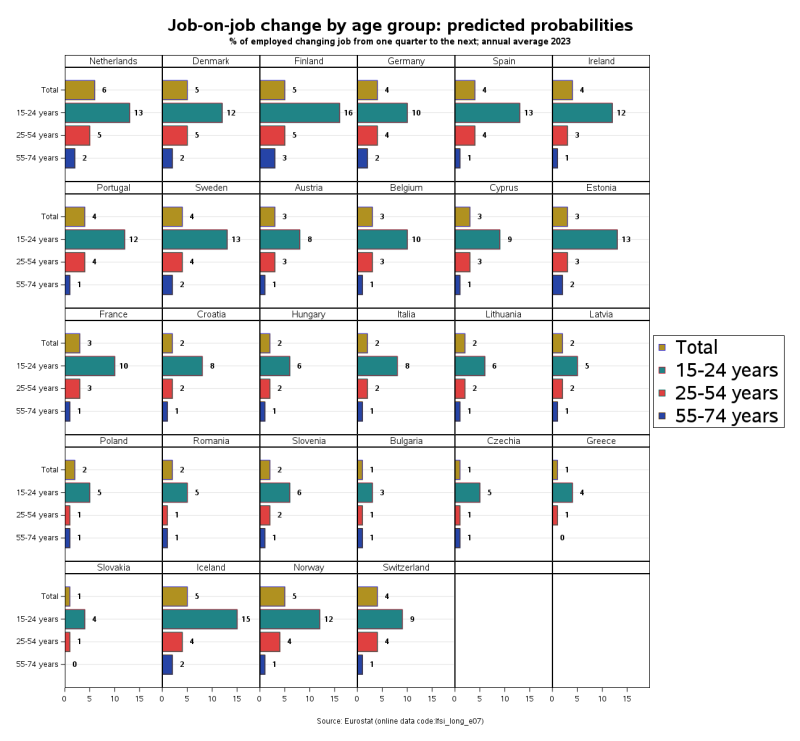
However, it is not that easy to produce these statistics, as the matched sample is relatively small for most countries; for quarterly transitions, quarterly data is pooled and annual averages are used. As this still does not result in a sufficiently large sample in many cases, a simple regression based method to estimate transition probabilities is applied to the flow of interest, e.g. unemployment to employment. The set of explanatory variables is chosen not depending on an underlying economic model, but is driven instead by the demand for specific breakdowns as mentioned above, as well as the availability of data in the EU-LFS, i.e. no external sources are used. The relevant advantage of the regression approach is that it allows us to include a function of age in the regression, exploiting the fact that we have a continuous variable at our disposal. This makes it possible to “borrow strength” from the distribution of age over the dependent variable. Predicted probabilities are derived from the estimated coefficients of the regression. Nine tables of breakdowns based on this methodology are currently published under Eurostat’s “experimental statistics” label. Figure 5 shows an example of the breakdown by age group for job-to-job transitions, an often requested flow based indicator. The figure shows the probability of an individual employed in both the initial and target quarter, having changed jobs in between (defined as starting a new work contract between the two interviews). The figure gives a good impression of the differences between countries with regard to total predicted probability. The probability of an employed individual changing jobs between two quarters in 2023 ranged from 6 % in the Netherlands to just 1 % in Bulgaria, Czechia, Greece and Slovakia. However, in all countries the transition probability for employed individuals aged 15-24 years was much higher than that of older workers, with the lowest rate found for those aged 55-74 years. This confirmation of a specific pattern for a breakdown for all countries, while overall transition probabilities are so different, shows the need for these as well as further breakdowns.
(in percentage of initially employed in the relevant age group)
Source: Eurostat (lfsi_long_e07)
Context
Employment and unemployment statistics can be used for a number of different analyses, including macroeconomic (looking at labour as a production factor), productivity or competitiveness studies. They can also be used to study a range of social and behavioural aspects related to an individual’s labour market situation, such as the social integration of minorities, employment as a source of household income and unemployment as a risk for poverty or social exclusion.
Employment and unemployment are both structural as well as short-term indicators. As structural indicators, they can shed light on the structure of labour markets and economic systems, as measured through the balance of labour supply and demand. As short-term indicators, they follow the business cycle; however, it has limits in this respect, as employment and unemployment are often referred to as a lagging indicator.
Flow statistics, as described in this article, aim to bridge the gap in understanding the dynamics between these two important indicators.
They are valuable in qualifying changes in unemployment and employment and help to make informed policy decisions. Understanding, for example, why the level of unemployed persons does not drop after an economic recovery will be easier when we consider the in-and outflows in and out of unemployment. Where unemployment stagnates because the substantial outflows from unemployment to employment are counterbalanced by inflows from inactivity to unemployment, this development can be judged as a recovery on the labour market despite stagnating unemployment levels: we can see that large numbers of persons outside the labour force start looking for work, and are therefore counted as unemployed. The decision to look for work might indicate that these individuals previously regarded their chances on the labour market as so low, that they did not even look for work (discouraged workers). The large outflows from unemployment to employment indicate that the demand for labour has in fact increased.
The situation is different if unemployment is stagnating because there are only minimal outflows of unemployment. In that case, flow statistics indicate that the economic recovery has not (yet) reached the labour market.

