Quarterly GDP growth
GDP down by 0.1 % in the euro area and stable in the EU
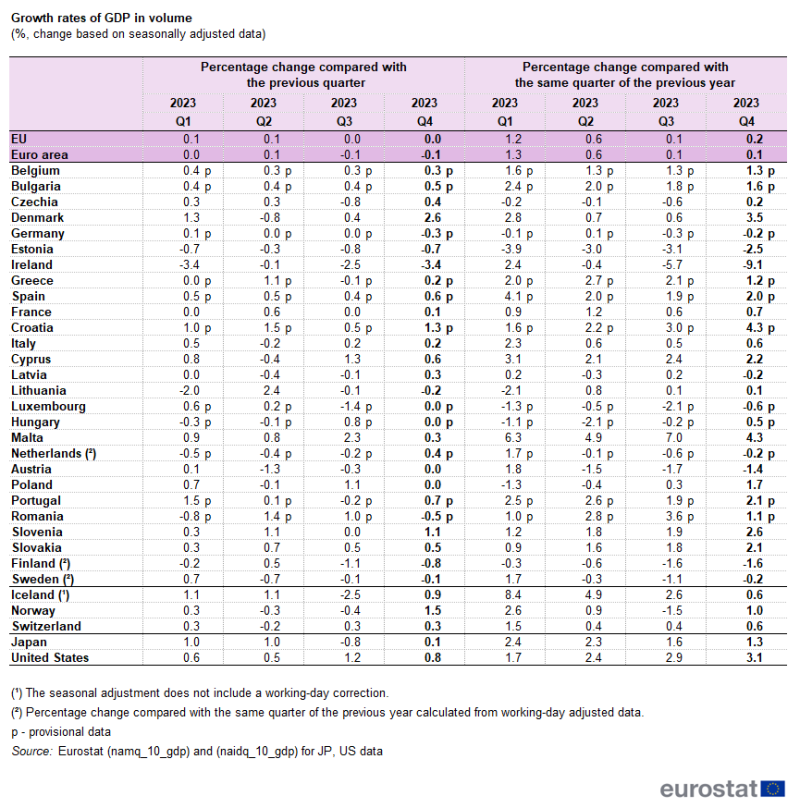
According to an estimate (see Data sources below) published by Eurostat, GDP decreased by 0.1 % in the euro area and remained stable in the EU in the fourth quarter of 2023, compared with the previous quarter. In the third quarter of 2023, GDP had decreased by 0.1 % in the euro area and had remained stable in the EU.
Compared with the same quarter of the previous year, seasonally adjusted GDP increased by 0.1 % in the euro area and by 0.2 % in the EU in the fourth quarter of 2023, after an increase of 0.1 % in both zones in the previous quarter.
During the fourth quarter of 2023, GDP in the United States increased by 0.8 % compared with the previous quarter (after +1.2 % in the third quarter of 2023). Compared with the same quarter of the previous year, GDP increased by 3.1 % (after +2.9 % in the previous quarter).
Source: Eurostat (namq_10_gdp) and (naidq_10_gdp) for Japan and US data
GDP growth by Member State
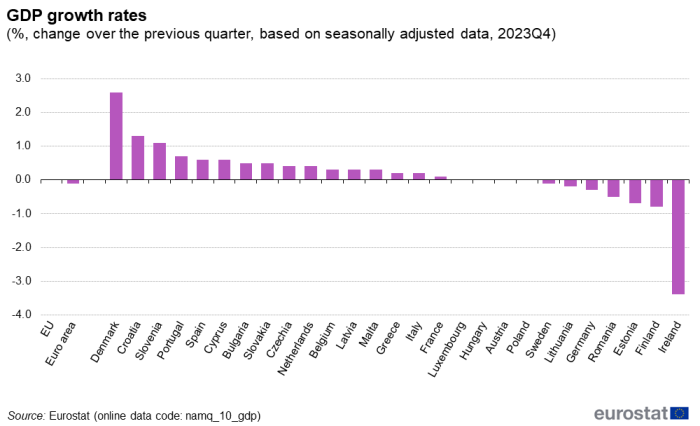
Among the EU Member States, the highest increases of GDP were recorded in Denmark (+2.6 %), Croatia (+1.3 %) and Slovenia (+1.1 %) in the fourth quarter of 2023, while the highest decreases were observed in Ireland (-3.4 %), Finland (-0.8 %) and Estonia (-0.7 %).
Source: Eurostat (namq_10_gdp)
GDP components and contributions to growth
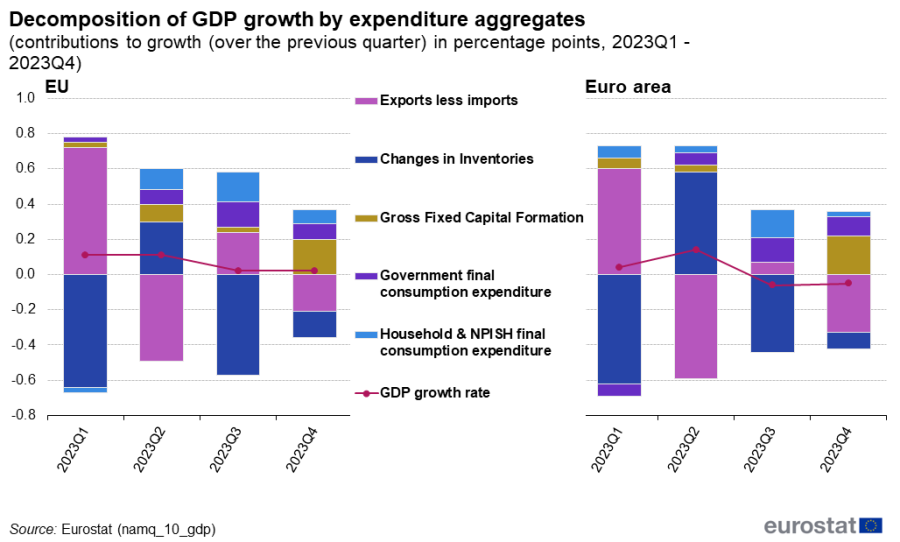
During the fourth quarter of 2023, household final consumption expenditure increased by 0.1 % in the euro area and by 0.2 % in the EU (after +0.3 % in both zones in the previous quarter). Government final consumption expenditure increased by 0.5 % in the euro area and by 0.4 % in the EU (after +0.7 % and +0.6 % respectively, in the previous quarter). Gross fixed capital formation increased by 1.0 % in the euro area and by 0.9 % in the EU (after 0.0 % in the euro area and +0.1 % in the EU in the previous quarter). Exports remained stable in the euro area and increased by 0.9 % in the EU (after -1.2 % in the euro area and -1.1 % in the EU in the previous quarter). Imports increased by 0.6 % in the euro area and by 1.3 % in the EU (after -1.4 % in the euro area and -1.6 % in the EU in the previous quarter).
Household final consumption expenditure had a negligible contribution to GDP growth in the euro area and was positive in the EU (+0.1 percentage points (pp)). The contribution from government final expenditure was positive in both zones (+0.1 pp). The contribution of gross fixed capital formation was positive for both the euro area and the EU (+0.2 pp). Changes in inventories had negative contributions to GDP growth both in the euro area (-0.1 pp) and in the EU (-0.2 pp). The contribution of exports less imports was negative both for the euro area and for the EU (-0.3 pp and -0.2 pp respectively).
Source: Eurostat Eurostat (namq_10_gdp)
Quarterly employment growth
Number of employed persons up by 0.3 % in the euro area and up by 0.2 % in the EU
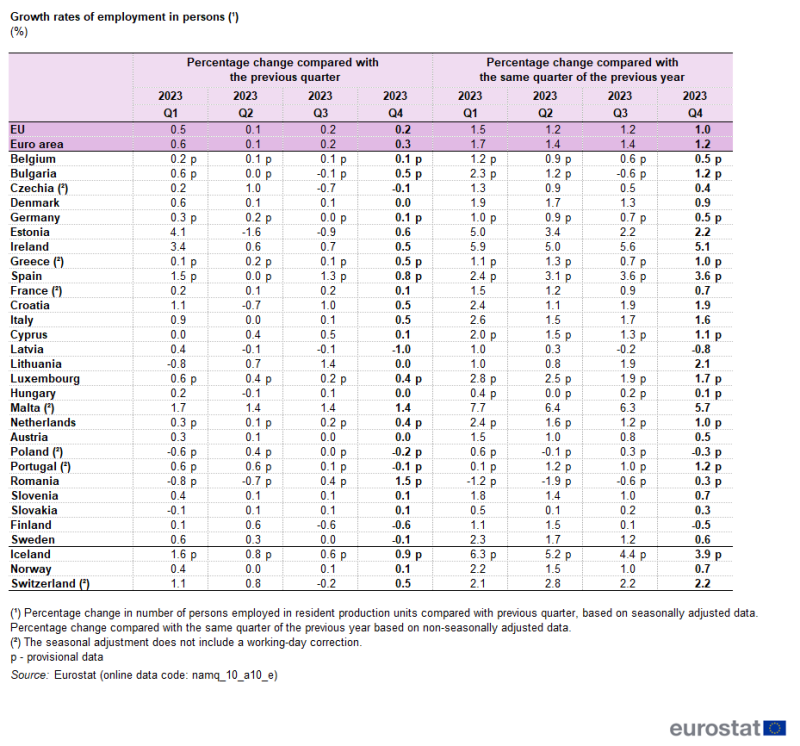
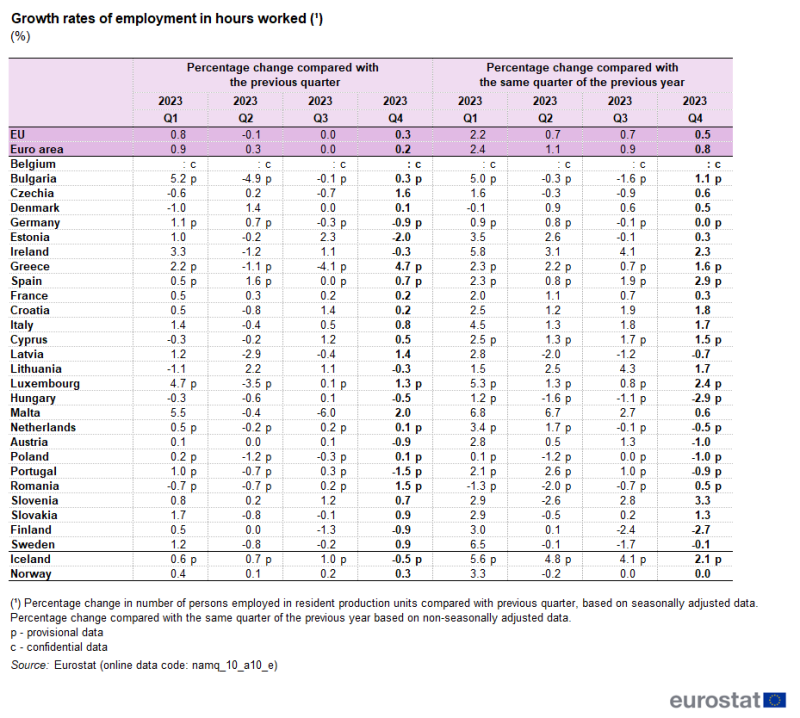
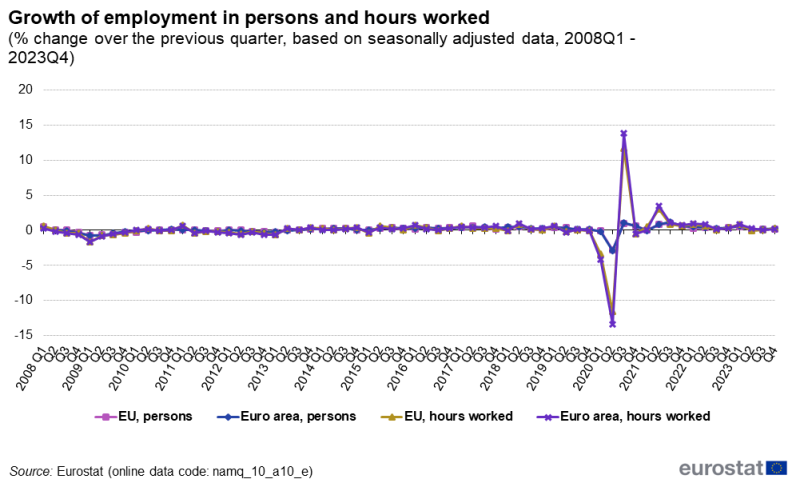
The number of persons employed increased by 0.3 % in the euro area and by 0.2 % in the EU in the fourth quarter of 2023 compared with the previous quarter. In the third quarter of 2023, employment had increased by 0.2 % in both the euro area and the EU. Hours worked increased by 0.2 % in the euro area and by 0.3 % in the EU in the fourth quarter of 2023 (after 0.0 % in both zones, in the third quarter of 2023).
Compared with the same quarter of the previous year, employment based on persons increased by 1.2 % in the euro area and by 1.0 % in the EU in the fourth quarter of 2023 (after +1.4 % in the euro area and +1.2 % in the EU in the third quarter of 2023). Number of hours worked increased by 0.8 % in the euro area and by 0.5 % in the EU in the fourth quarter of 2023, compared with the same quarter of the previous year (after +0.9 % and +0.7 % respectively in the third quarter of 2023).
These data on employment provide a picture of labour input consistent with the output and income measure of national accounts.
Source: Eurostat (namq_10_a10_e)
Source: Eurostat (namq_10_a10_e)
Source: Eurostat (namq_10_a10_e)
Employment growth by Member State
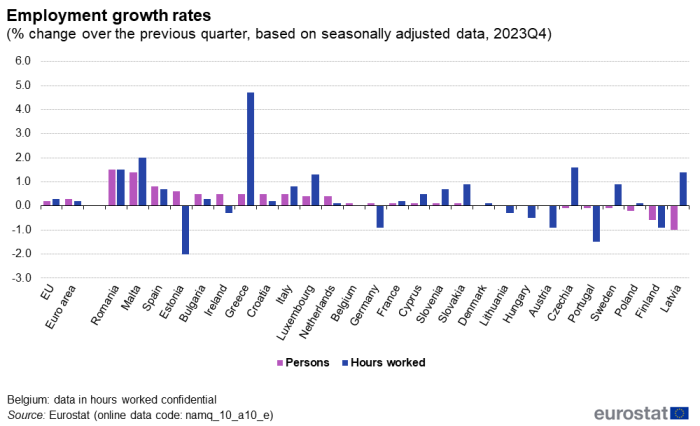
Among EU Member States, the highest increases in employment in persons were observed in Romania (+1.5 %), Malta (+1.4 %) and Spain (+0.8 %). Latvia (-1.0 %), Finland (-0.6 %) and Poland (-0.2 %) recorded the highest declines in the fourth quarter of 2023 compared with the previous quarter.
Greece (+4.7 %), Malta (+2.0 %) and Czechia (+1.6 %) exhibited the highest increases in employment measured in hours worked. Estonia (-2.0 %), Portugal (-1.5 %), Germany, Austria and Finland (all -0.9 %) showed the highest decreases in the fourth quarter of 2023 compared with the previous quarter.
Source: Eurostat (namq_10_a10_e)
Employment levels
Employment in persons increased by 0.5 million in the euro area and in the EU
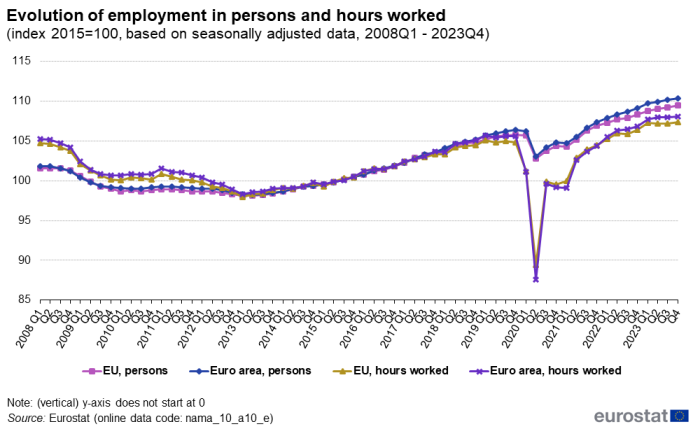
Based on seasonally adjusted figures, Eurostat estimates that in the fourth quarter of 2023, 217.2 million people were employed in the EU, of whom 169.3 million were in the euro area.
Source: Eurostat (namq_10_a10_e)
Labour productivity
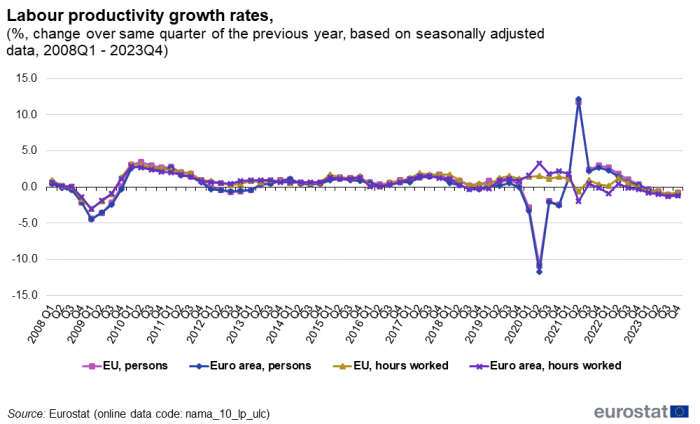
The combination of GDP and employment data allows an estimation of labour productivity. The analysis of growth compared with the same quarter of the previous year shows that productivity growth (based on employed persons) fluctuated around 1 % for both zones between 2013 and 2018 before the COVID-19 pandemic caused high volatility in 2020.
In the fourth quarter of 2023, productivity based on persons decreased by 1.1 % in the euro area and by 0.8 % in the EU compared with the same quarter of the previous year.
Compared with the same quarter of the previous year, productivity based on hours worked decreased by 1.2 % in the euro area and by 0.7 % in the EU.
Source: Eurostat (namq_10_lp_ulc)
Source data for tables and graphs
Data sources
Eurostat collects GDP and employment data in the framework of ESA 2010. Additional information on the dissemination of ESA 2010 data is available under latest news on the dedicated website and in the database section National Accounts (ESA 2010).
European aggregates are published at specific release dates. The preliminary flash estimate of GDP growth of the first quarter of 2024 will be released on 30 April 2024 and will be updated on 15 May 2024. The next regular estimates of European aggregates are due on 7 June 2024 (for both GDP and employment estimates). Revision triangles for GDP for the euro area and the EU can be found here. These revision triangles are updated once per quarter.
Please note that EU Member States are expected to carry out a benchmark revision in 2024.
For further details see the Eurostat website.
Context
Quarterly figures on the evolution of gross domestic product (GDP) and its main aggregates are among the most significant indicators of the state of any economy, be it at a national or European level and are of key interest to users. Typical users of quarterly national accounts (QNA) figures are market analysts, forecasters or economic and monetary policy advisors interested in assessing the state of the current business cycle.
The ESA 2010 distinguishes between two employment concepts depending on geographical coverage: resident persons in employment (i.e. the national scope of employment) and employment in resident production units irrespective of the place of residence of the employed person (i.e. domestic scope). The ESA 2010 recognises several employment measures: persons, hours worked and jobs. Eurostat publishes mainly employment data measured in persons and in hours worked.

