Main concept
A job may be considered temporary employment (and its holder a temporary employee) if both employer and employee agree that its end is decided by objective rules (usually written down in a work contract of limited duration). These rules can be a specific date, the end of a task, or the return of another employee who has been temporarily replaced.
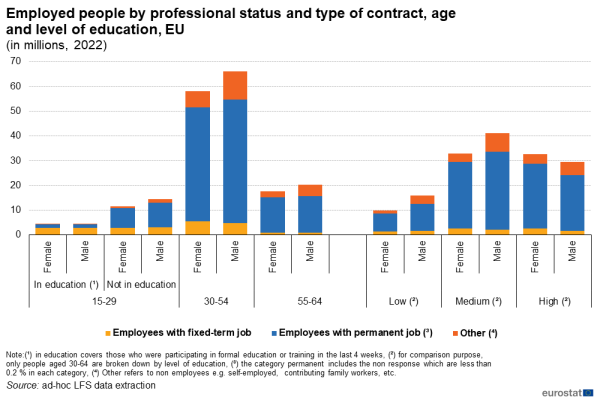
Typical cases can be people in seasonal employment; people engaged first by an agency or employment exchange and then hired to a third party to do a specific task (unless there is a written work contract of unlimited duration); people with specific training contracts. In 2022, 24 million people aged 15-64 worked under fixed-term contract in the EU.
In 2022, the reasons given by temporary workers aged 25-64 for being employed under such contracts were as follows: the worker did not find a permanent job (36.7 %), the job is only available with a temporary contract (25.2 %), the contract refers to a probation period (12.3 %), the worker did not want a permanent job (8.2 %), other reason (8.2 %), the worker is in education or training (6.5 %). For 2.9 % of temporary workers, no reason was specified. However, among people aged 15-29, the most frequent reason for being temporary workers was the participation in education or training (28.7 %) while the remaining reasons followed the same ranking as for people aged 25-64.
Developments in temporary employment
This second part covers temporary employment overall, for those aged 15-64. The focus is on the shares of employees having temporary contracts in the total employed people. Changes in time are discussed and comparisons between countries and gender are described.
Slight rebound in temporary jobs for women in 2021 and 2022
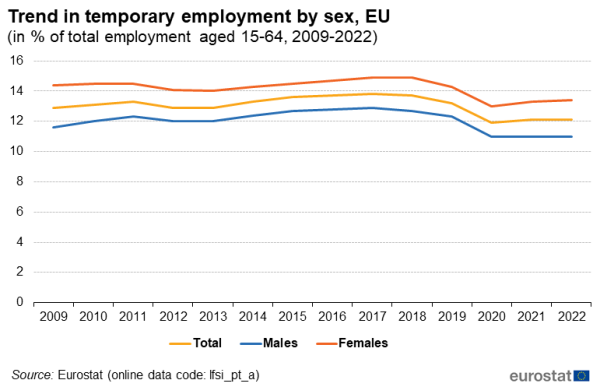
After increasing significantly between 2013 and 2017, the share of temporary workers in the total employed people aged 15-64 declined over the 4-year period 2017-2020 from 13.8 % in 2017 to 11.9 % in 2020. In 2021, after the COVID-19 pandemic, it increased to 12.1% and remained stable in 2022. However, temporary employment revealed differences between women and men: in 2022, 13.4 % of employed women worked under temporary contract against 11.0 % of employed men (see Figure 1).
The upward trend between 2013 and 2017 and the downward trend between 2017 and 2020 in temporary employment was roughly the same for women and men. Nevertheless, the male share of temporary contracts remained stable in 2021 and 2022 while the female share increased by 0.4 percentage points between 2020 and 2022.
(in % of total employment aged 15-64, 2009-2022)
Source: Eurostat (lfsi_pt_a)
Investigating whether the trend in temporary employment follows the same trend as for other employed people might be relevant for understanding better the changes. The comparison of annual changes of both categories over the period 2009-2022 indicates that, most of the time, the number of temporary workers varied to a larger extent than the number of employed people working under permanent contracts or as self-employed. Only in 2010 and in 2018 was the change in the number of employees working under temporary contract smaller than for other workers (see Figure 2). Moreover, the two categories recorded the same change (i.e. increase or decrease) except in 2010 and in 2011 when the temporary employment increased by respectively 0.6 % and 1.2 % while the number of other workers decreased by respectively 1.6 % and 0.1 % and, in 2019, when both categories saw an opposite change (-2.8 % for temporary employment and + 1.5 % for employment other than temporary). It is also relevant to underline the significant impact of the COVID-19 pandemic on temporary employment in 2020 when the number of temporary workers decreased by 11.5 % meanwhile the number of other employed people decreased by 0.4 %.
In 2022, temporary employment increased by 2.5 %, which was similar to the growth rate recorded for the other workers having a permanent contract or working as self-employed or contributing family workers (2.2 %).
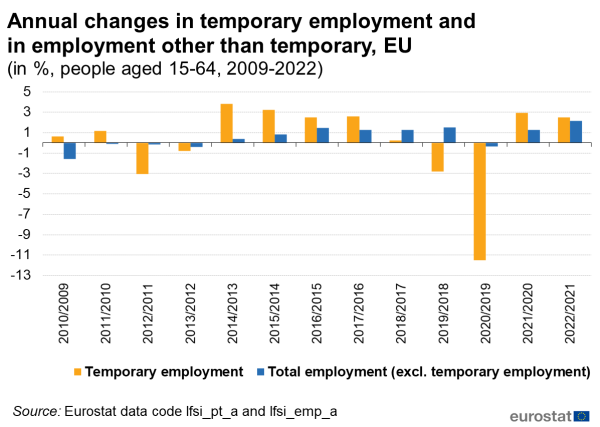
(in %, people aged 15-64, 2009-2022)
Source: Eurostat (lfsi_pt_a) and (lfsi_emp_a)
Worker profile and countries
More younger people, more women and more people with a low level of education in temporary employment
Looking at the age, sex and level of education of temporary workers highlights the higher frequency of temporary workers among younger employed people, women and workers with a low level of education.
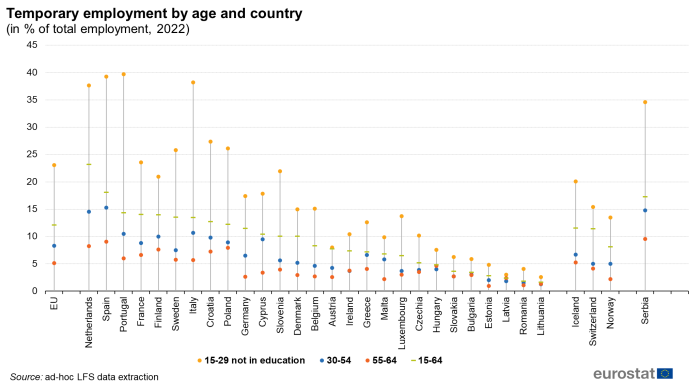
- Younger people aged 15-29 in general are more likely to be employed under temporary contracts (see Figure 3). However, breaking down young people into two groups by their participation in formal education shows significant differences. Slightly more than 60 % of employed women and men aged 15-29 participating in education were temporary workers in 2022 (61.2 % for women and 63.5 % for men). Among women and men aged 15-29 who were not participating in education, almost one quarter was working under such contracts (respectively 24.8 % and 21.7 %). This share fell below 10 % for those aged 30-54 (9.6 % for women and 7.1 % for men) and below 6 % for women and men aged 55-64 (5.7 % for women and 4.6 % for men). Moreover, it is interesting to highlight that the total number of temporary workers among young people aged 15-29 regardless of their participation in formal education exceeded the number of temporary workers aged 30-54.
- As regards the level of education, women and men aged 30-64 with a low level of education were more likely to be employed under temporary contract (respectively 13.9 % and 11.0 % of the total female and male employment) in comparison with temporary workers with a medium level of education (7.7 % of employed women and 5.5 % of employed men) or with a high level of education (8.2 % of employed women and 5.5 % of employed men).
More than 15 % of employed people in the Netherlands and Spain work under temporary contract
Considering people aged 15-64, 12.1 % of total employed people were temporary workers in 2022 in the EU. Among EU countries, the highest shares were recorded in the Netherlands (23.2 %) and in Spain (18.1 %) and the lowest shares (all below 3 %) in Lithuania (1.6 %), Romania (1.8 %), Latvia (2.4 %) and Estonia (2.8 %).
- The share of temporary workers among employed people aged 15-29 and not participating in education varies significantly across EU countries. In 2022, it reached 39.7 % in Portugal, 39.2 % in Spain, 38.2 % in Italy and 37.6 % in the Netherlands and was below 5 % in Lithuania (2.6 %), Latvia (3.0 %), Romania (4.0 %) and Estonia (4.8 %).
- Among employed people aged 30-54, the highest shares of temporary employment were reported by Spain (15.3 %), the Netherlands (14.6 %), Italy (10.7 %), Portugal (10.5 %) and Finland (10.0 %) while the lowest shares (all less than 2 %) were reported by Lithuania (1.3 %), Romania (1.5 %) and Latvia (1.8 %).
- As regards people aged 55-64, differences were not so pronounced among EU countries. The countries where temporary employment affected employed people aged 55-64 the most were Spain (9.1 %), the Netherlands (8.2 %), Poland (7.9 %), Finland (7.6 %) and Croatia (7.2 %).
In Slovenia, 6.5 % of employed women are temporary employment agency workers
In 2022, 2.6 % of the total employed people were temporary employment agency workers. At EU level, males were more likely to work under such status (2.8 %) than women (2.3 %). In Slovenia, the Netherlands and Slovakia, more than 1 in 20 workers in 2022 was an agency worker (respectively, 5.9 %, 5.2 % and 5.1 %). This type of employment was not so frequent in Bulgaria (0.2 %), Romania (0.3 %) and Poland (0.4 %) where it concerned a very low percentage of working people. In most EU countries (17 in 25 countries for which data is available), men were more likely to work as agency workers than women. The highest shares of agency workers were recorded in Slovenia for women (6.5 %) and in the Netherlands for men (6.1 %).
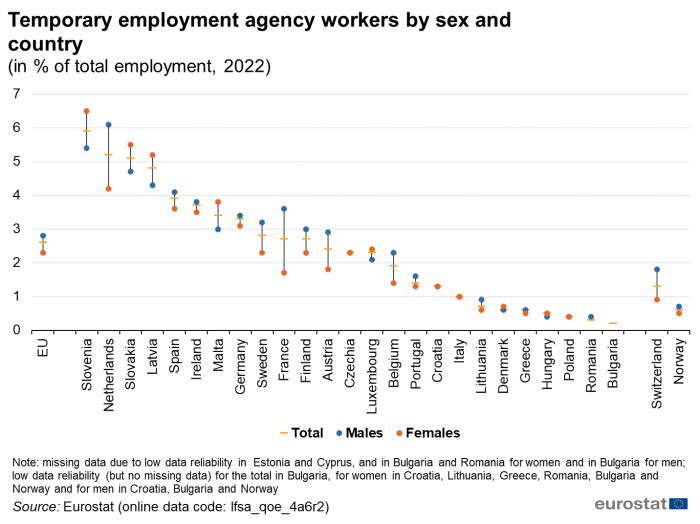
(in % of total employment, 2022)
Source: Eurostat (lfsa_qoe_4a6r2)
Fixed-term contracts by occupation
Comparing the distribution of temporary workers with the distribution of the total employment (excluding temporary employment) by main ISCO-08 occupational categories (see Figure 6) may help to inform on the occupational categories in which temporary workers are employed, and to investigate whether the temporary employment is over-represented or under-represented in the occupational categories in comparison with other employed people (i.e. employees with permanent contracts, self-employed people and contributing family workers).
In 2022, 20.8 % of the total temporary workers were services and sales worker against 15.4 % among the other employed people. The services and sales workers provide personal and protective services related to travel, housekeeping, catering, personal care, protection against fire and unlawful acts; or demonstrate and sell goods. Approximately the same share of temporary workers were professionals (e.g. teachers, engineers, scientists, usually higher qualified people) (20.3 %) while professionals represented 22.1 % of non-temporary workers. The widest gap was found among elementary occupations which consist of simple and routine tasks which mainly require the use of hand-held tools and often some physical effort: 15.7 % of temporary workers were employed in this category against 7.5 % of other workers. At the end of the scale, only 1.2 % of temporary workers were managers against 5.6 % of non-temporary workers.
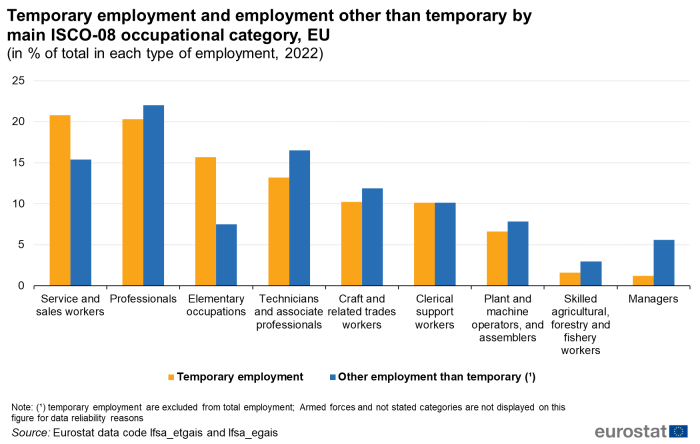
(in % of total in each type of employment, 2022)
Source: Eurostat (lfsa_etgais) and (lfsa_egais)
Presence of children in the household
Almost 1 in 5 employed women with a low level of education and having children work under a fixed-term contract in the EU
In the EU, the share of temporary employment also differs significantly according to the level of education and to the presence of children in the household.
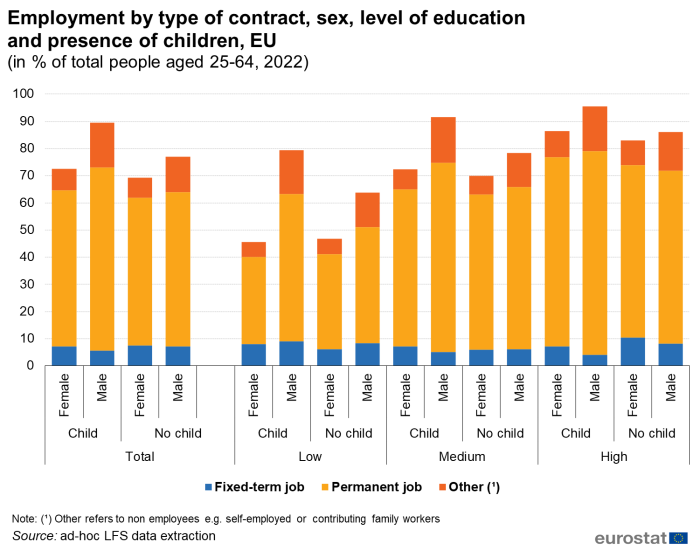
Figure 7 shows the employment rate of people aged 25-64 by level of education, presence or absence of children and sex. The share of employed people is broken down by type of contract. Looking at the 2022 results, the highest share of temporary employment in the total employed people was found among low qualified women with children (17.7 %), which was also the category that had the lowest employment rate (45.6 %). The category of low qualified men and women without children recorded the second and third highest share of temporary employment (respectively 13.1 % and 13.0 %) and, respectively, the third and second lowest employment rate (respectively 63.8 % and 46.8 %). Shares of temporary employment above 10 % were also reported by women with a high level of education without children (12.6 %) and by low qualified men with children (11.5 %). At the same time, the lowest shares of temporary employment were reported by men with a high level of education and with children (4.3 %) and by men with a medium level of education and with children (5.7 %).
Regardless of the level of education, the largest difference between female and male temporary employment in total employment aged 25-64 was observed among those with children: 10.0 % of female workers were temporary workers against 6.3 % for men (3.7 percentage points (pp.) of difference). In the same period, 10.9 % of employed women without children had a temporary contract against 9.3 % of employed men (1.6 pp. of difference).
For each level of education, the difference in the share of temporary employment between women and men with children was larger than for those without children. Differences amounted to 6.2 pp. for those with a low level of education and with children, 4.3 pp. for those with a medium level of education and with children and 3.9 pp. for those with a high level of education and with children.
Source data for tables and graphs
Methods and definitions
Data sources
Source: The European Union Labour Force Survey (EU-LFS) is the largest European household sample survey providing quarterly and annual results on labour participation of people aged 15 years and over as well as on persons outside the labour force. It covers residents in private households. Conscripts in military or community service are not included in the results. The EU-LFS is based on the same target populations and uses the same definitions in all countries, which means that the results are comparable between the countries. The EU-LFS is an important source of information about the situation and trends in the national and EU labour markets. Each quarter around 1.8 million interviews are conducted throughout the participating countries to obtain statistical information for some 100 variables. Due to the diversity of information and the large sample size, the EU-LFS is also an important source for other European statistics like Education statistics or Regional statistics.
Reference period: Yearly results are obtained as averages of the four quarters in the year.
Coverage: The results from the survey currently cover all European Union Member States, the EFTA Member States Iceland, Norway and Switzerland, as well as the candidate countries Montenegro, North Macedonia, Serbia and Türkiye.
For Cyprus, the survey covers only the areas of Cyprus controlled by the Government of the Republic of Cyprus.
European aggregates: EU refers to the totality of the EU of 27 Member States. If data are unavailable for a country, the calculation of the corresponding aggregates takes into account the data for the same country for the most recent period available. Such cases are indicated.
Country notes
The Netherlands collects EU-LFS data using a rolling reference week instead of a fixed reference week, i.e. interviewed persons are asked about the situation of the week before the interview rather than a pre-selected week.
Definitions
The concepts and definitions used in the EU-LFS follow the guidelines of the International Labour Organisation (ILO).
Employment covers persons living in private households, who during the reference week performed work, even for just one hour, for pay, profit or family gain, or were not at work but had a job or business from which they were temporarily absent, for example because of illness, holidays, industrial dispute or education and training.
Employment can be measured in terms of the number of persons or jobs, in full-time equivalents or in hours worked. All the estimates presented in this article use the number of persons; the information presented for employment rates is also built on estimates for the number of persons. Employment statistics are frequently reported as employment rates to discount the changing size of countries’ populations over time and to facilitate comparisons between countries of different sizes. These rates are typically published for the working age population, which is generally considered to be those aged between 15 and 64 years. The 15 to 64 years age range is also a standard used by other international statistical organisations (although the age range of 20 to 64 years is given increasing prominence by some policymakers as a rising share of the EU population continue their studies into tertiary education).
The LFS employment concept differs from national accounts domestic employment, as the latter sets no limit on age or type of household, and also includes the non-resident population contributing to GDP and conscripts in military or community service.
Different articles on detailed technical and methodological information are available through: EU labour force survey.
Please note that Eurostat provides two sets of indicators linked to the annual employment rate, which serve different purposes and which in some cases differ from each other:
1) The LFS main indicators, which contains seasonally adjusted series. They include the labour market headline indicators used e.g. in the Macroeconomic Imbalance Procedure Scoreboard or the European Statistical Recovery Dashboard and are consequently used for monitoring policy. They have only a few breakdowns and normally refer to the age group 20-64 years.
2) The detailed results, which contain series that are not seasonally adjusted. They have a large number of breakdowns and can therefore be used for more detailed analysis.
Main concepts: Some main employment characteristics, as defined by the EU-LFS, include:
- employees are defined as those who work for a public or private employer and who receive compensation in the form of wages, salaries, payment by results, or payment in kind; non-conscript members of the armed forces are also included;
- self-employed persons work in their own business, farm or professional practice. A self-employed person is considered to be working during the reference week if she/he meets one of the following criteria: works for the purpose of earning profit; spends time on the operation of a business; or is currently establishing a business;
- the distinction between full-time and part-time work is generally based on a spontaneous response by the respondent. The main exceptions are the Netherlands and Iceland where a 35 hours threshold is applied, Sweden where a threshold is applied to the self-employed, and Norway where persons working between 32 and 36 hours are asked whether this is a full- or part-time position;
- an employee is considered as having a temporary job if employer and employee agree that its end is determined by objective conditions, such as a specific date, the completion of an assignment, or the return of an employee who is temporarily replaced. Typical cases include: people in seasonal employment; people engaged by an agency or employment exchange and hired to a third party to perform a specific task (unless there is a written work contract of unlimited duration); people with specific training contracts.
Educational attainment refers to the highest level of education successfully completed. Educational levels are defined and classified according to the International Standard Classification of Education, 2011 version (ISCED 2011).
General education is defined as education programmes that are designed to develop learners’ general knowledge, skills and competencies, as well as literacy and numeracy skills, often to prepare participants for more advanced education programmes at the same or a higher ISCED level and to lay the foundation for lifelong learning.
Vocational education is defined as education programmes that are designed for learners to acquire the knowledge, skills and competencies specific to a particular occupation, trade, or class of occupations or trades. Such programmes may have work-based components (e.g. apprenticeships, dual-system education programmes).
For more information about the distinction between general and vocational education, please consult paragraphs 53 to 55 of ISCED 2011.
Time series
Regulation (EU) 2019/1700 came into force on 1 January 2021 and induced a break in the LFS time series for several EU Member States. In order to monitor the evolution of employment and unemployment despite of the break in the time series, Member States assessed the impact of the break in their country and computed impact factors or break corrected data for a set of indicators. Break corrected data are published for the LFS main indicators.
More information on the LFS can be found via the online publication EU Labour Force Survey, which includes eight articles on the technical and methodological aspects of the survey. The EU-LFS methodology in force from the 2021 data collection onwards is described in methodology from 2021 onwards. Detailed information on coding lists, explanatory notes and classifications used over time can be found under documentation.
Context
Employment statistics can be used for a number of different analyses, including macroeconomic (looking at labour as a production factor), productivity or competitiveness studies. They can also be used to study a range of social and behavioural aspects related to an individual’s employment situation, such as the social integration of minorities, or employment as a source of household income.
Employment is both a structural indicator and a short-term indicator. As a structural indicator, it may shed light on the structure of labour markets and economic systems, as measured through the balance of labour supply and demand, or the quality of employment. As a short-term indicator, employment follows the business cycle; however, it has limits in this respect, as employment is often referred to as a lagging indicator.
Employment statistics are at the heart of many EU policies. The European employment strategy (EES) was launched at the Luxembourg jobs summit in November 1997 and was revamped in 2005 to align the EU’s employment strategy more closely to a set of revised Lisbon objectives, and in July 2008, employment policy guidelines for the period 2008–2010 were updated. In March 2010, the European Commission launched the Europe 2020 strategy for smart, sustainable and inclusive growth; this was formally adopted by the European Council in June 2010. The European Council agreed on five headline targets, the first being to raise the employment rate for women and men aged 20 to 64 years old to 75 % by 2020. EU Member States may set their own national targets in the light of these headline targets and draw up national reform programmes that include the actions they aim to undertake in order to implement the strategy.
The European Pillar of Social Rights has been jointly signed by the European Parliament, the Council and the Commission on 17 November 2017. Employment and social policies are the main fields of interest of the European Pillar of Social Rights, which is about delivering new and more effective rights for citizens. It has 3 main categories: (1) Equal opportunities and access to the labour market, (2) Fair working conditions and (3) Social protection and inclusion. In particular, today’s more flexible working arrangements provide new job opportunities especially for the young but can potentially give rise to new precariousness and inequalities. Building a fairer Europe and strengthening its social dimension is a key priority for the Commission. The European Pillar of Social Rights is accompanied by a ‘social scoreboard’ which will monitor the implementation of the Pillar by tracking trends and performances across EU Member States in 12 areas and will feed into the European Semester of economic policy coordination. The scoreboard will also serve to assess progress towards a social ‘triple A’ for the EU as a whole.
At the Informal meeting of heads of state or government of 7-8 May 2021, EU leaders discussed on the implementation of the European pillar of social rights at EU and national level, as established by the EU strategic agenda 2019-2024. The action plan presented by the Commission in March 2021 provides guidance on the implementation of the European pillar of social rights, including in the areas of employment, skills and social protection. The action plan also sets three main targets to be achieved throughout the European Union by 2030:
- an employment rate of at least 78 % in the EU;
- at least 60 % of adults attending training courses every year;
- a reduction of at least 15 million in the number of people at risk of social exclusion or poverty.
For more information, see here.

