

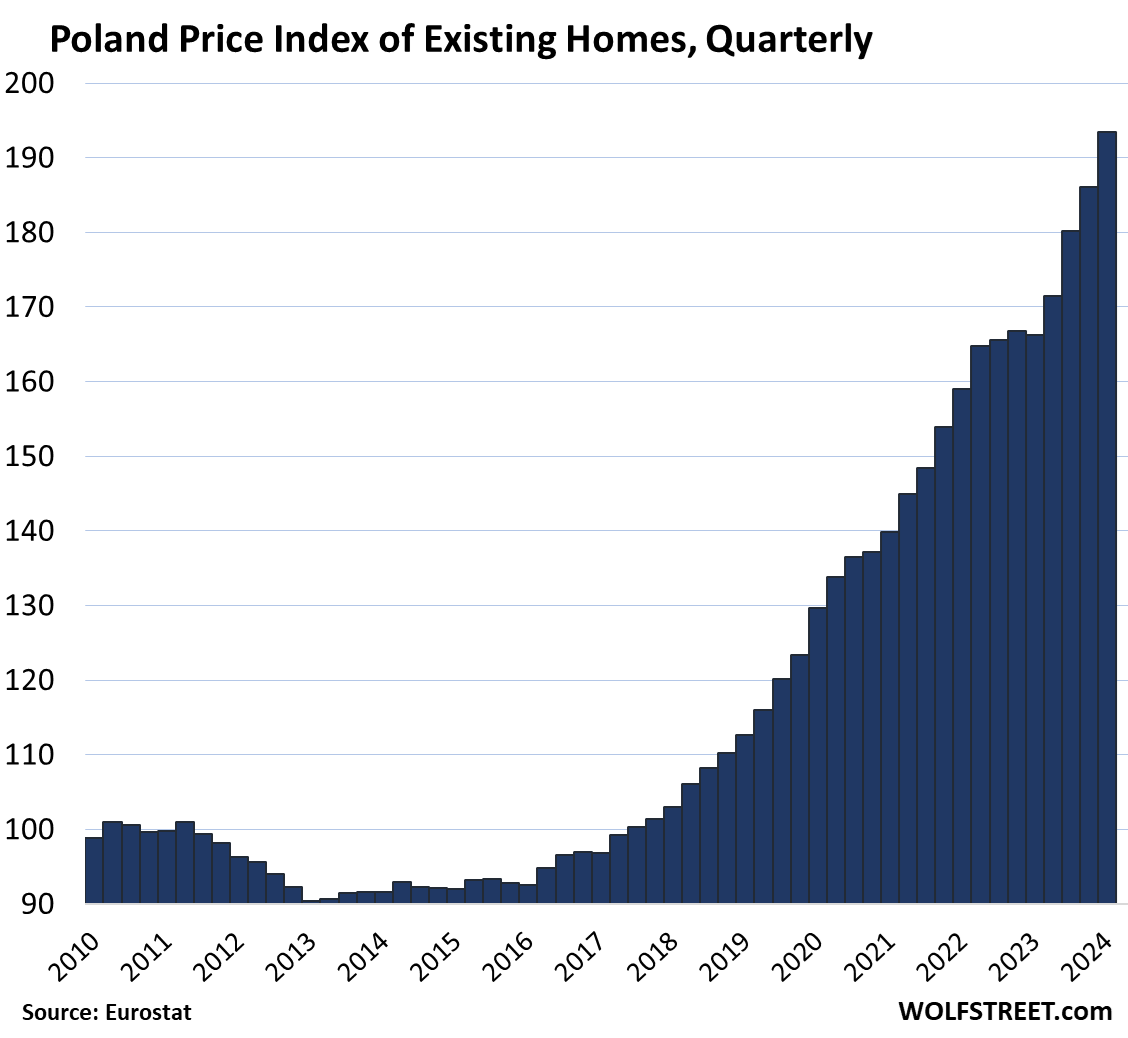
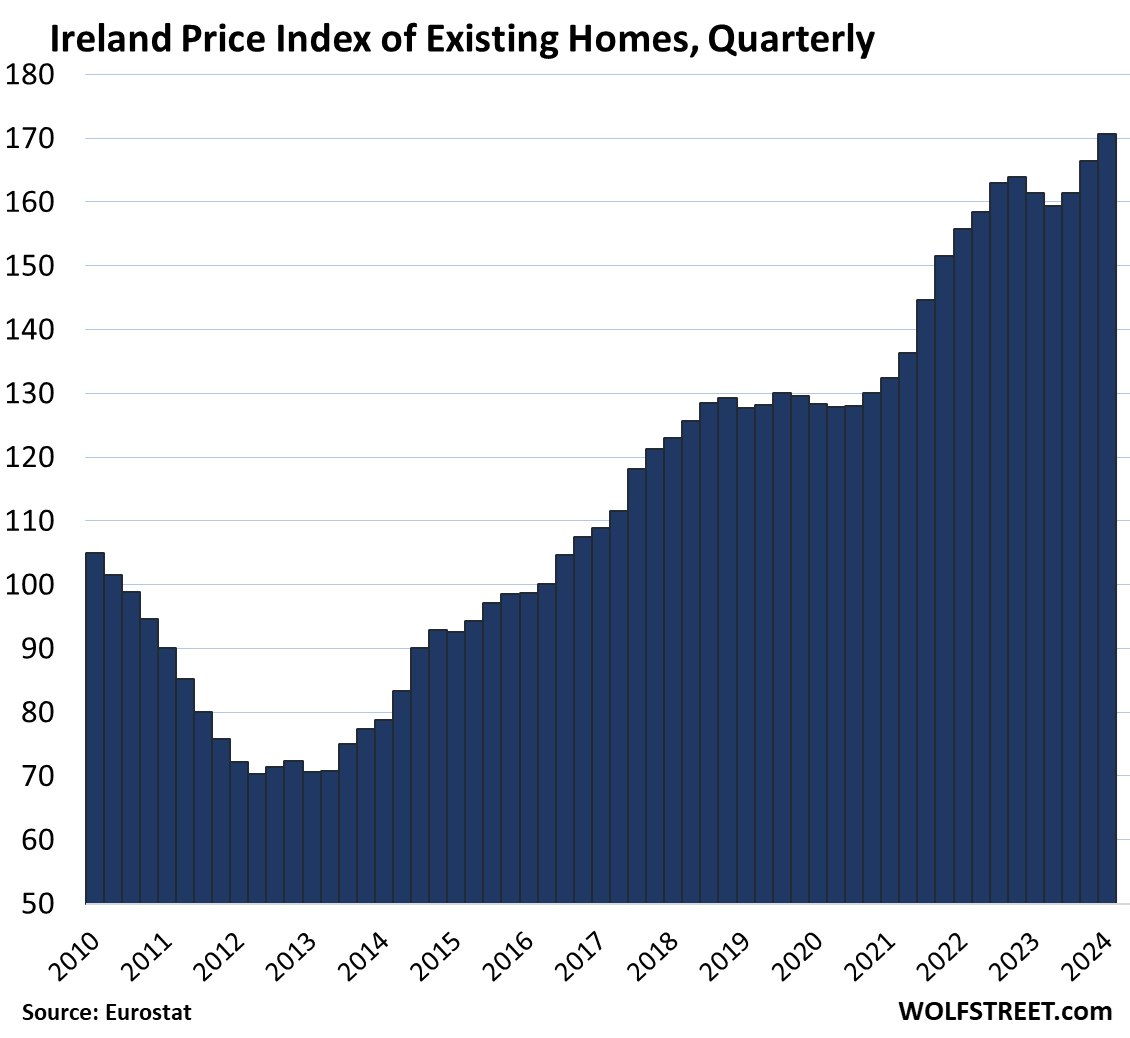
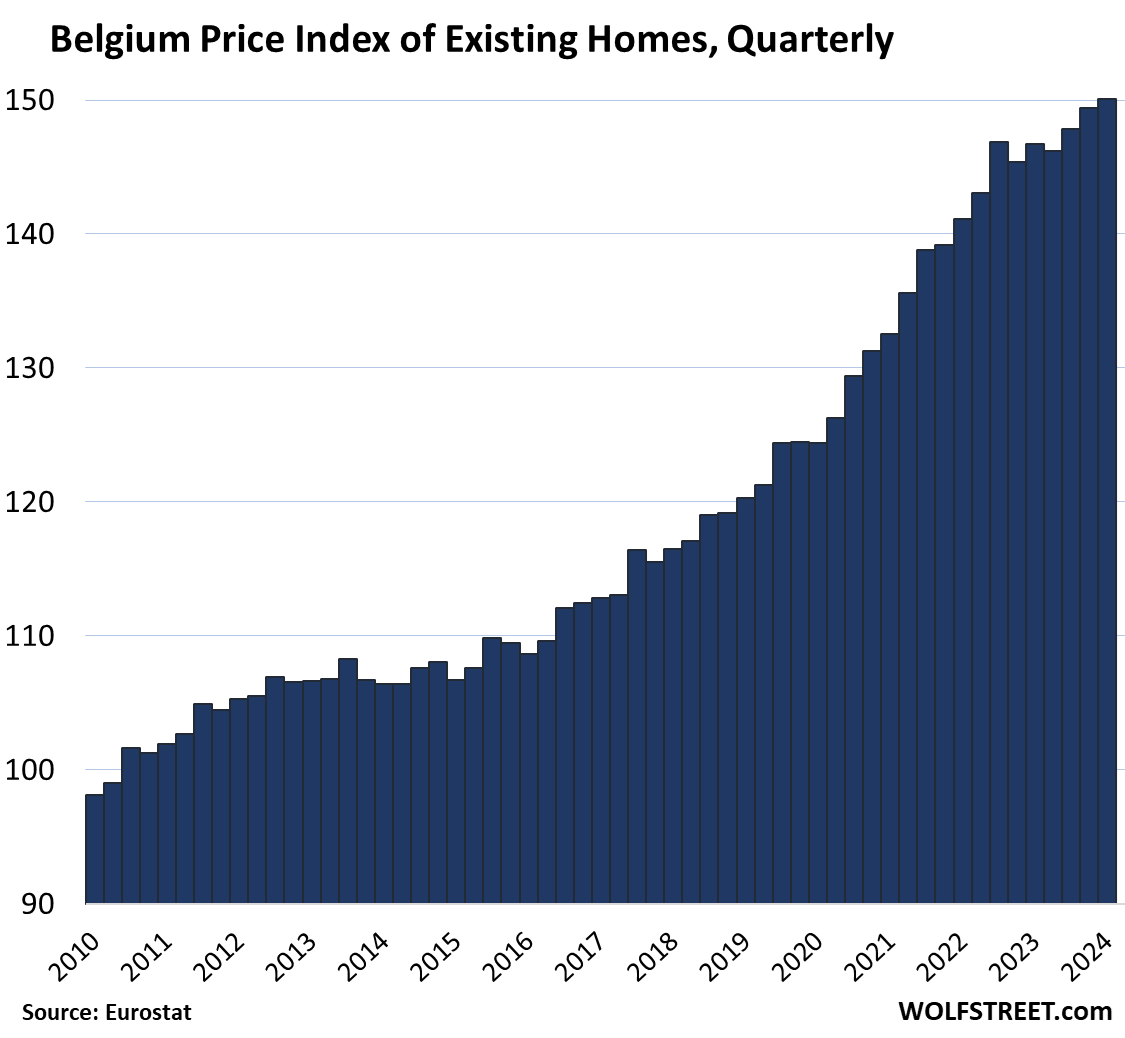
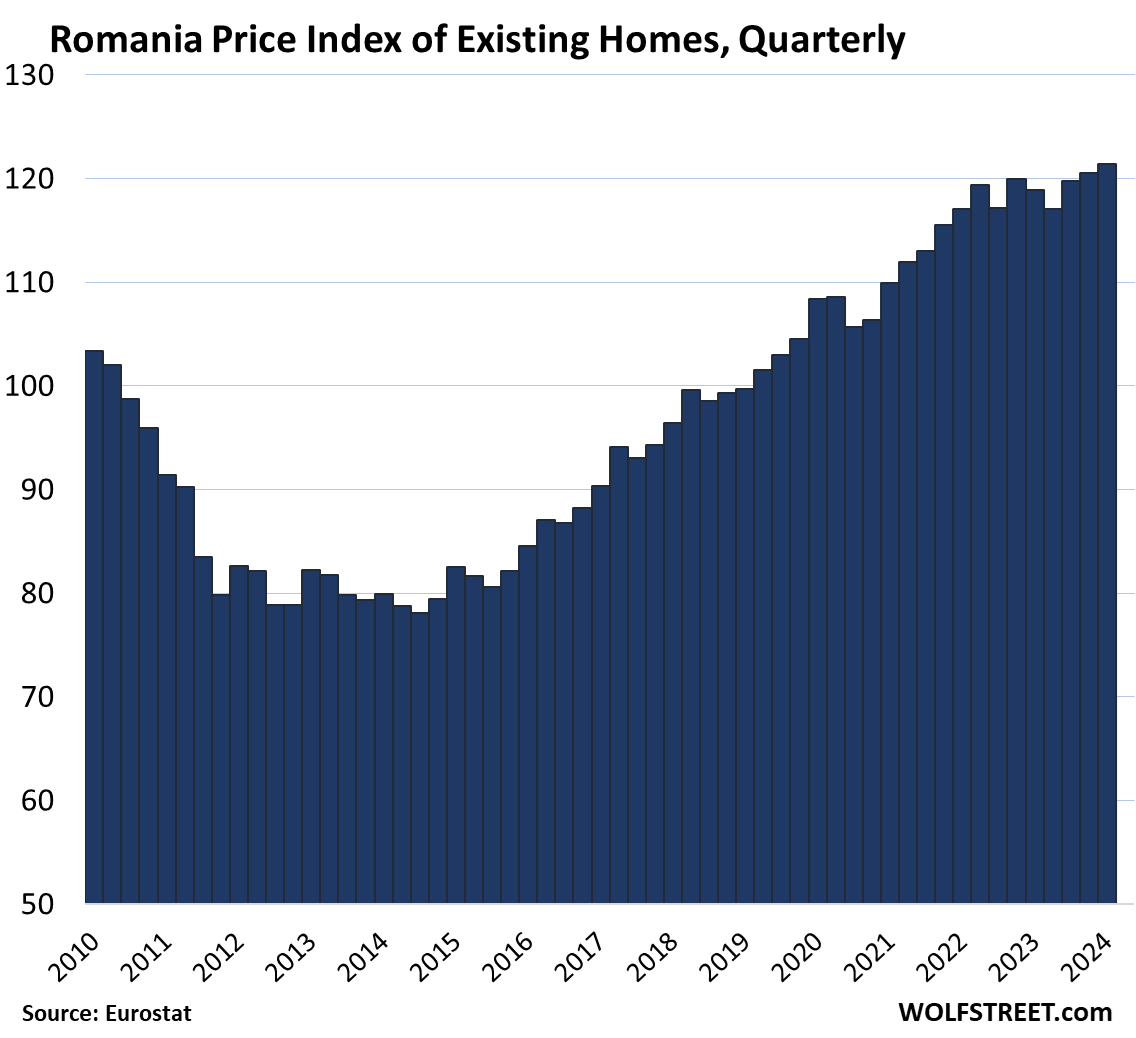
But new highs in Portugal, Spain, Poland, Belgium, Ireland, Romania. A wild ride.
By Wolf Richter for WOLF STREET.
Location, location, location, I mean, country, country, country is the mantra in real estate. We’re going on a wild ride across sales prices of existing homes (“dwellings”) of all types in the 16 largest counties that are either in the European Union (EU) or in the European Economic Area (EEA), based on data from Eurostat through Q1, released on Friday. The data goes back to 2010.
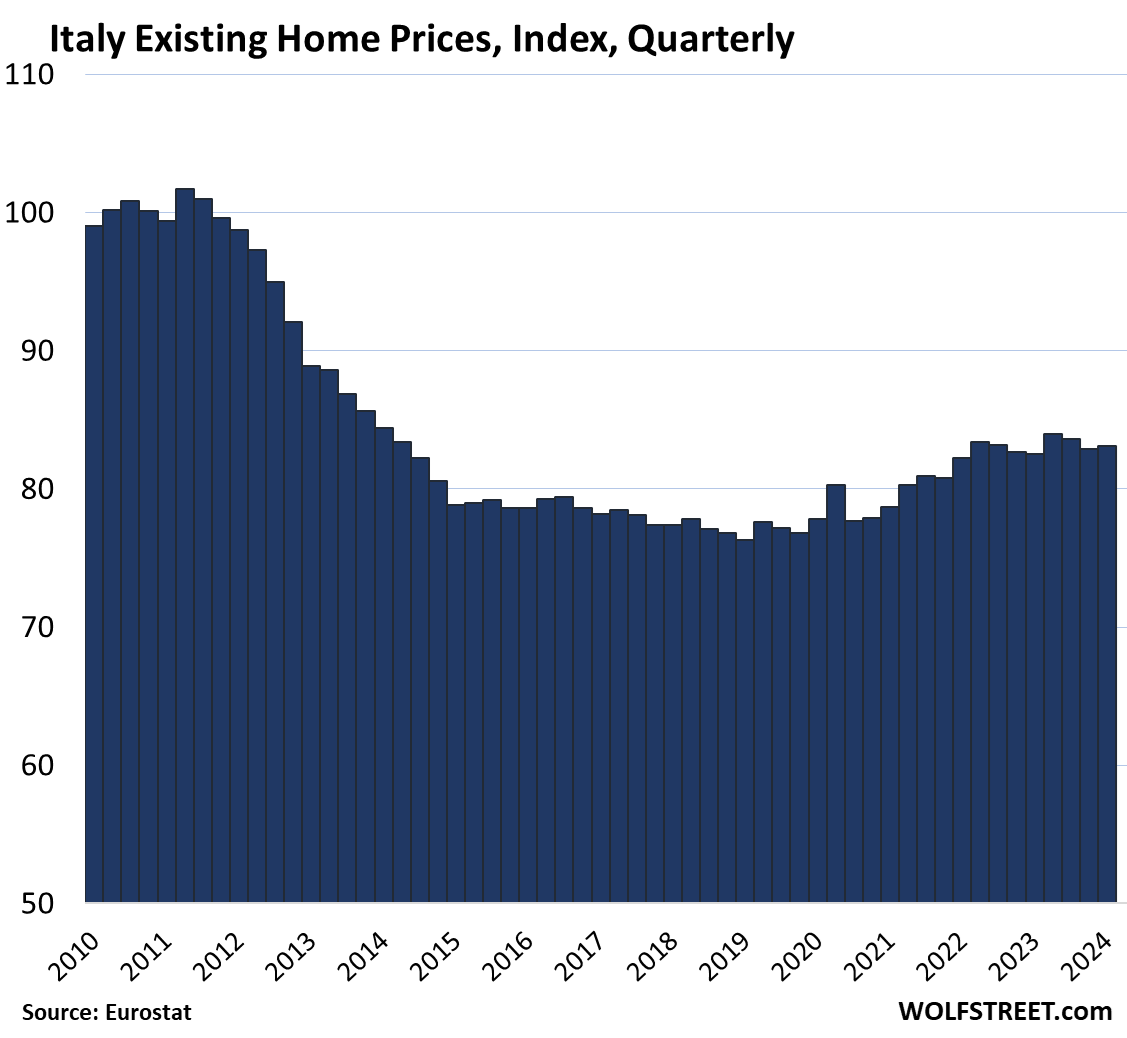
It’s going to be a wild ride because some countries have indeed the most splendid housing bubbles that are now deflating, others have most splendid bubbles that are not yet deflating and hit new highs, and others, such as Italy, are at or below were they were in 2010.
The biggest decliners from the peak:
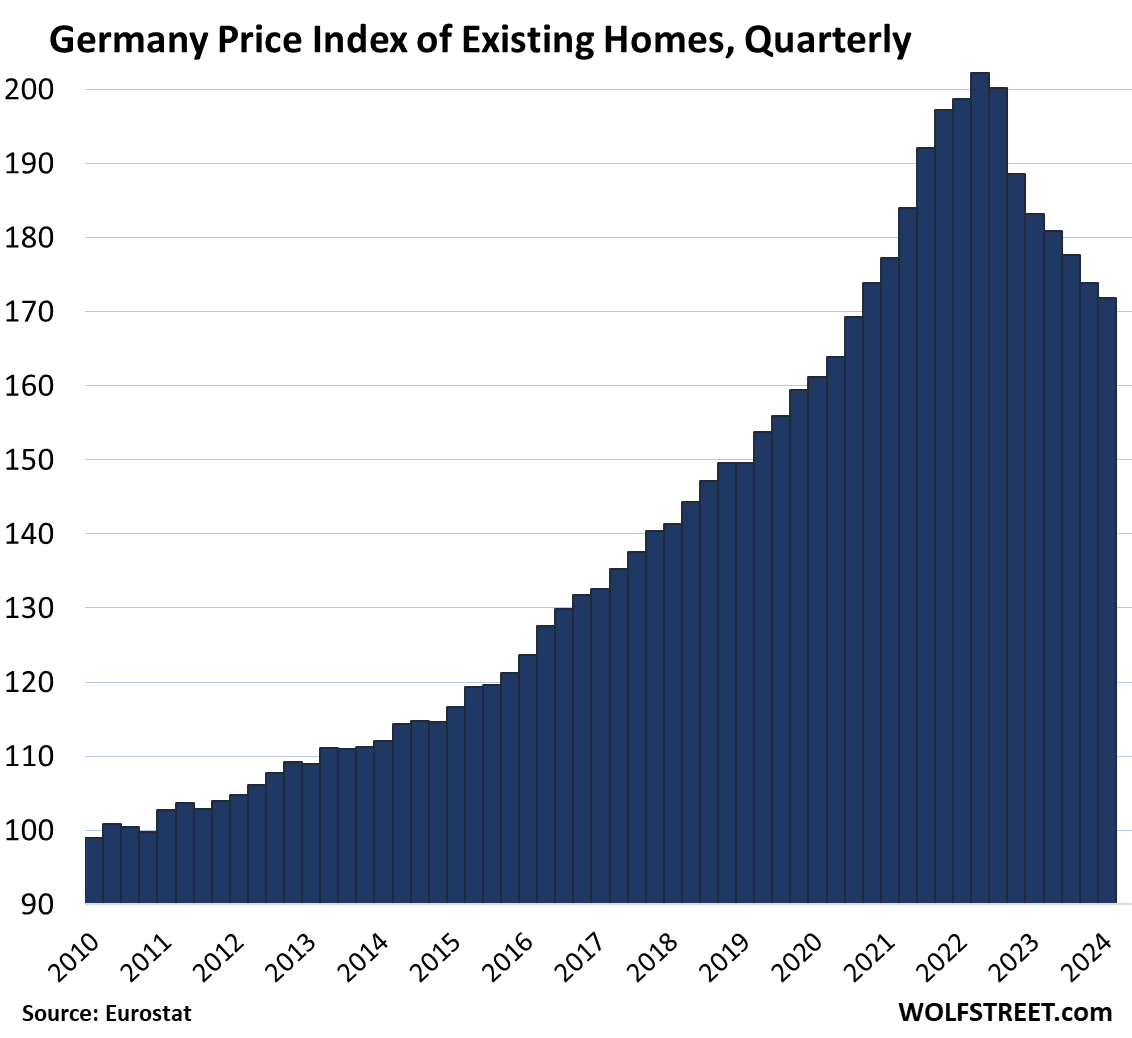
- Germany: -15.0%
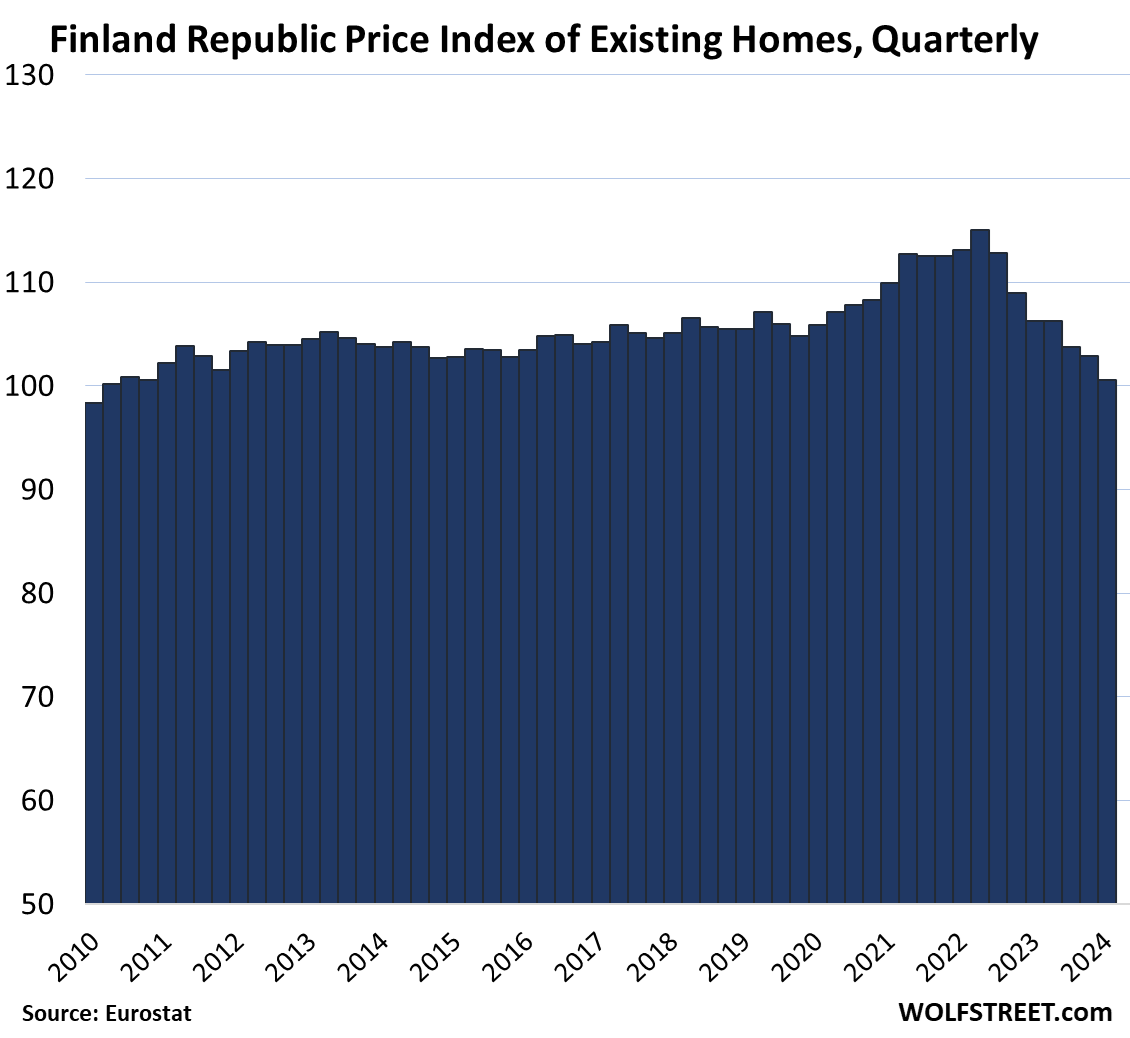
- Finland: -12.6%
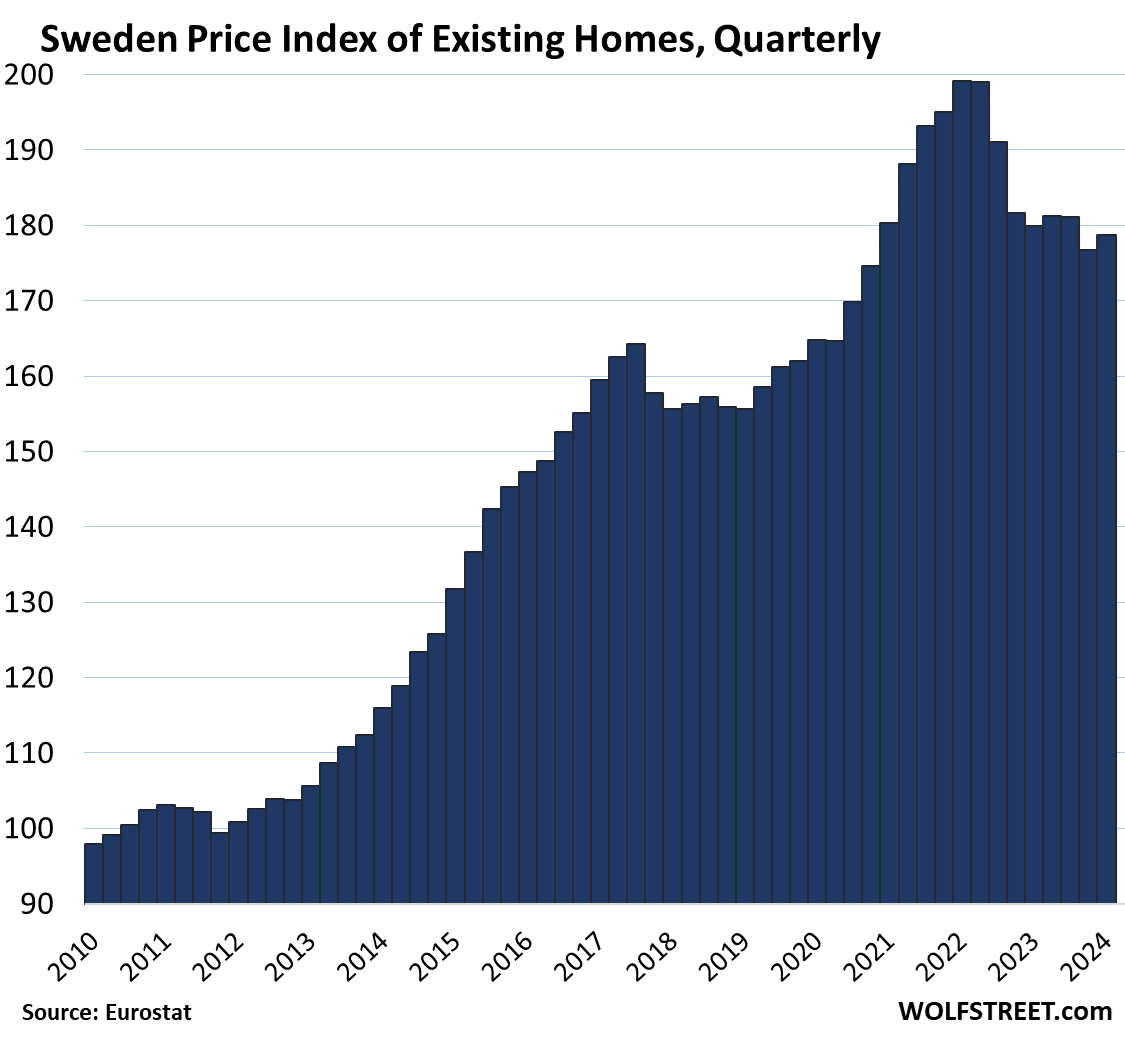
- Sweden: -10.3%
- Austria: -9.6%
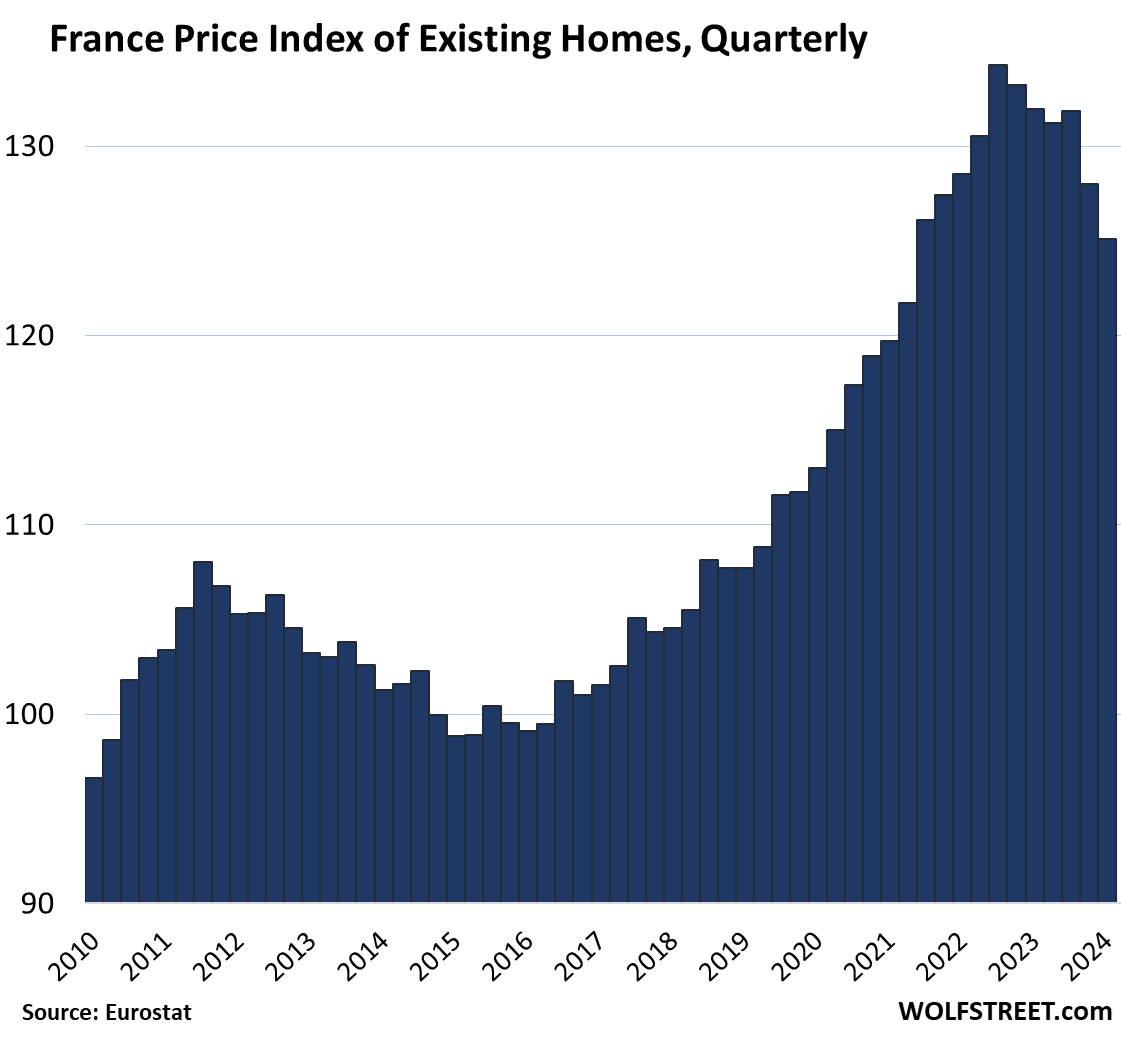
- France: -6.8%
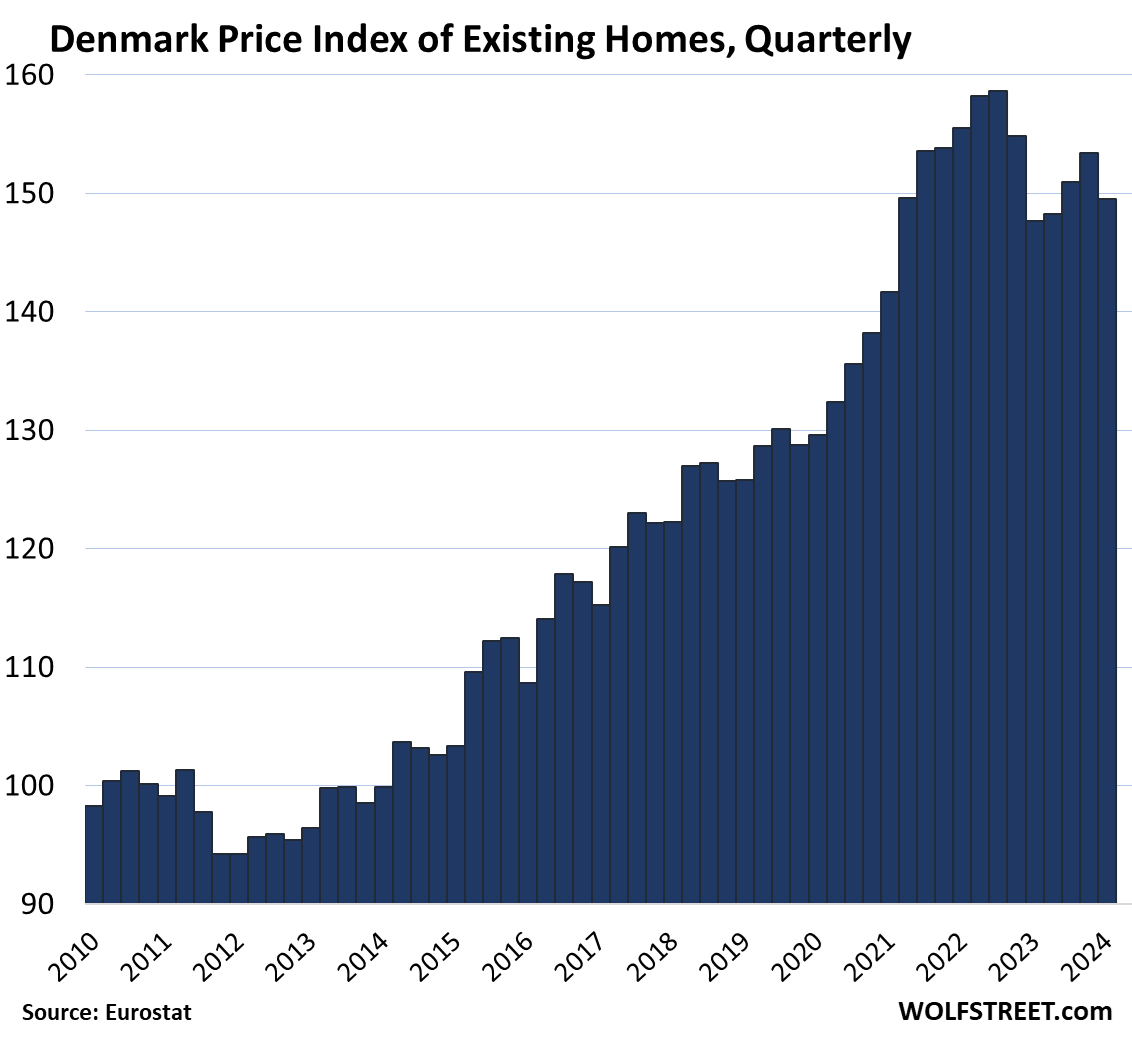
- Denmark: -5.8%
The most splendid housing bubbles:
These are biggest gainers from 2010 to their respective peak. All six more than doubled:
- Austria: +136%
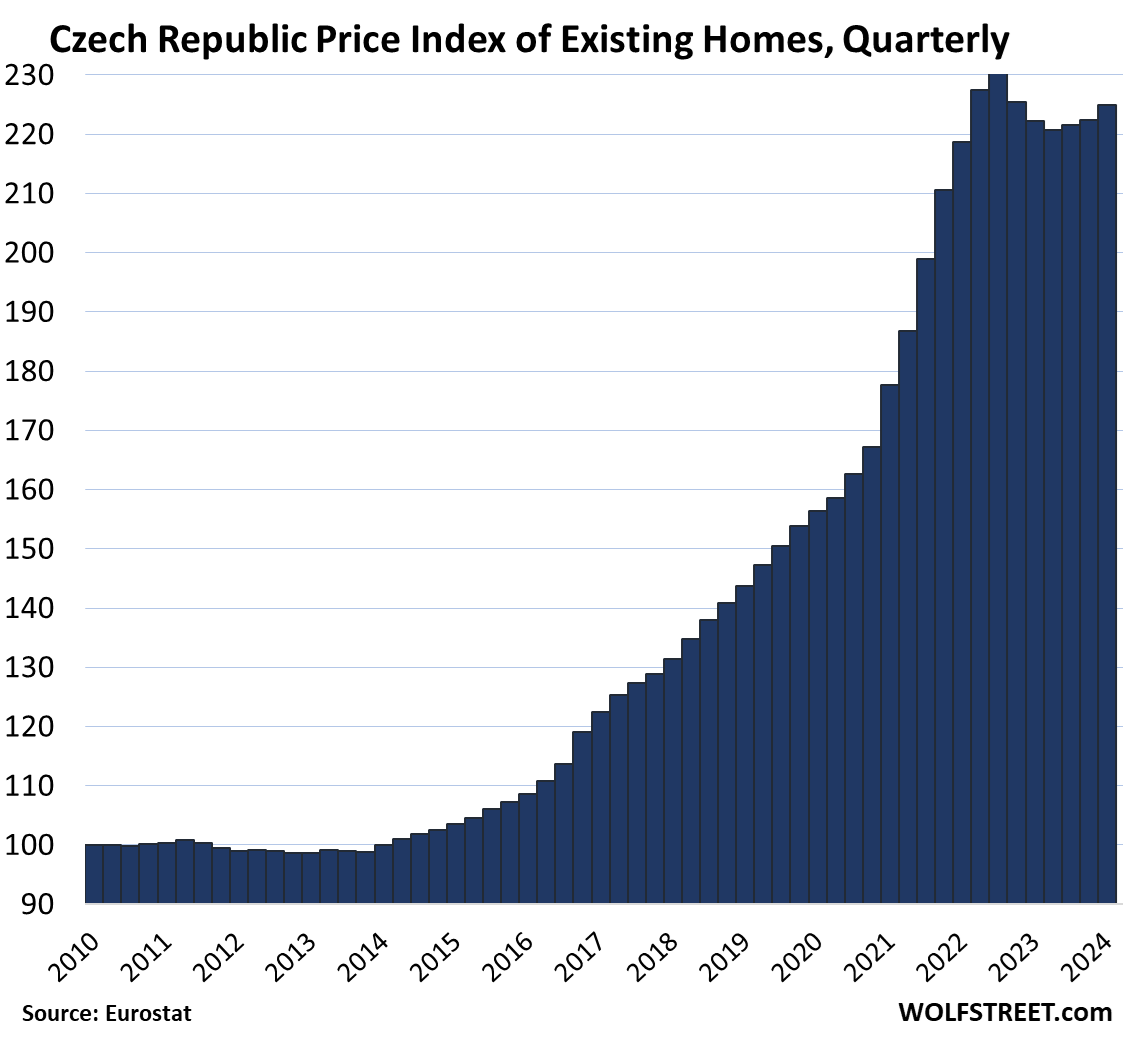
- Czech Republic: +130%
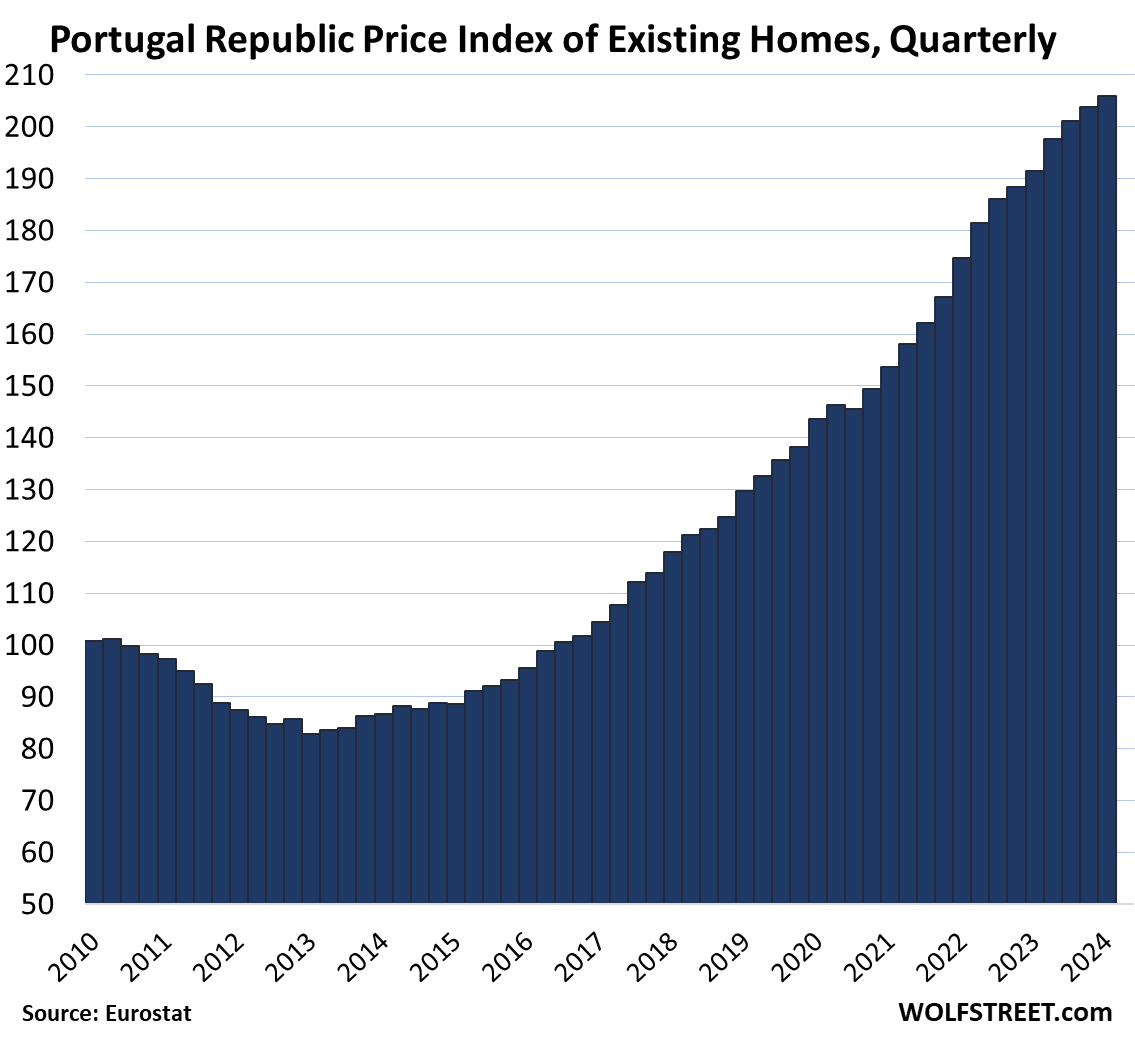
- Portugal: +104%
- Germany: +104%
- Sweden: +103%
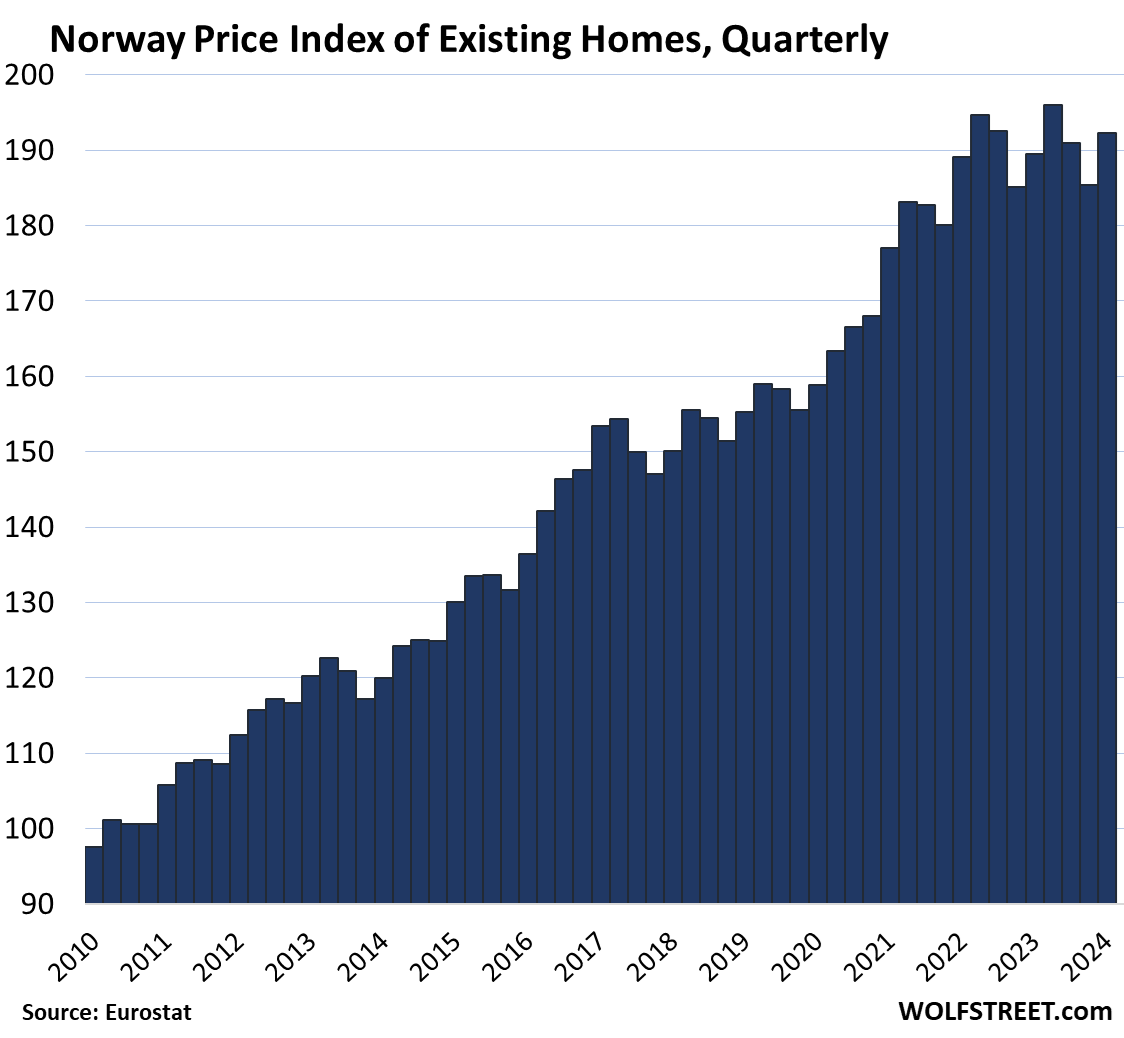
- Norway: +101%
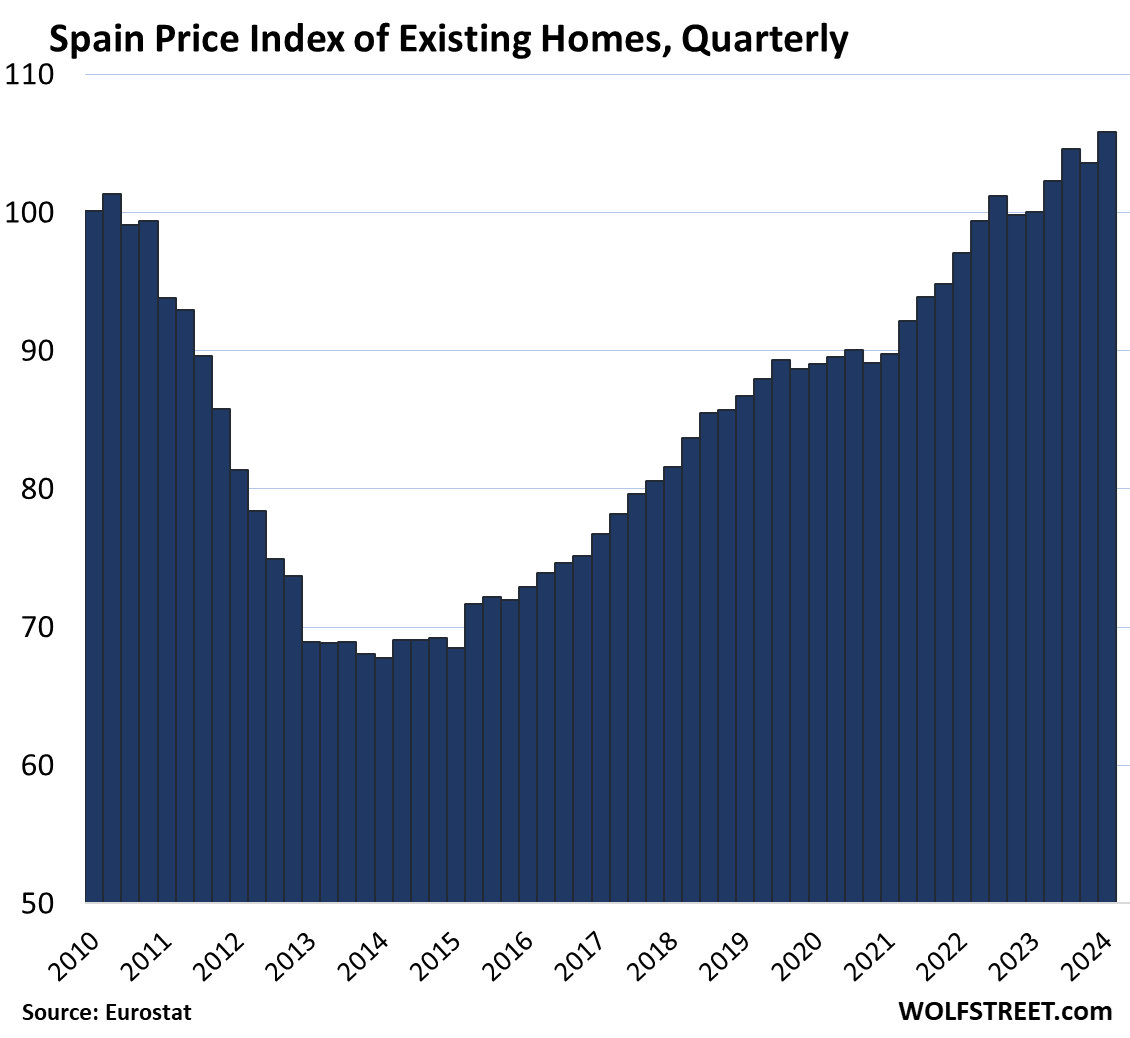
But Italy’s home prices are below where they had been in 2010. Finland’s home prices have now dropped back to where they’d been in 2010. And Spain’s home prices, after a deep trough, are just 5.7% above where they’d been in 2010. These markets are at the other end of the spectrum. Spain had a fabulously splendid housing bubble that imploded spectacularly, but it happened before 2010, and the implosion dragged into 2015, after which prices rose again.
In order of the increase from 2010 through the peak. All indices here are set at 100 for 2010. So when an index is now at 200, it means the prices have doubled (+100%) since 2010.
| Austria, Prices of Existing Homes | |||
| 2010 to Peak | QoQ | YoY | From peak |
| 136.2% | -0.8% | -4.6% | -9.6% |
| Czech Republic, Prices of Existing Homes | |||
| 2010 to Peak | QoQ | YoY | From peak |
| 130.3% | 1.2% | 1.3% | -2.3% |
| Portugal, Prices of Existing Homes | |||
| 2010 to Peak | QoQ | YoY | From peak |
| 104.4% | 1.1% | 7.6% | New high |
| Germany, Prices of Existing Homes | |||
| 2010 to Peak | QoQ | YoY | From peak |
| 104.2% | -1.1% | -6.2% | -15.0% |
| Sweden, Prices of Existing Homes | |||
| 2010 to Peak | QoQ | YoY | From peak |
| 103.2% | 1.1% | -0.7% | -10.3% |
| Norway, Prices of Existing Homes | |||
| 2010 to Peak | QoQ | YoY | From peak |
| 100.8% | 3.7% | 1.5% | -1.8% |
| Poland, Prices of Existing Homes | |||
| 2010 to Peak | QoQ | YoY | From peak |
| 95.7% | 4.0% | 16.4% | New high |
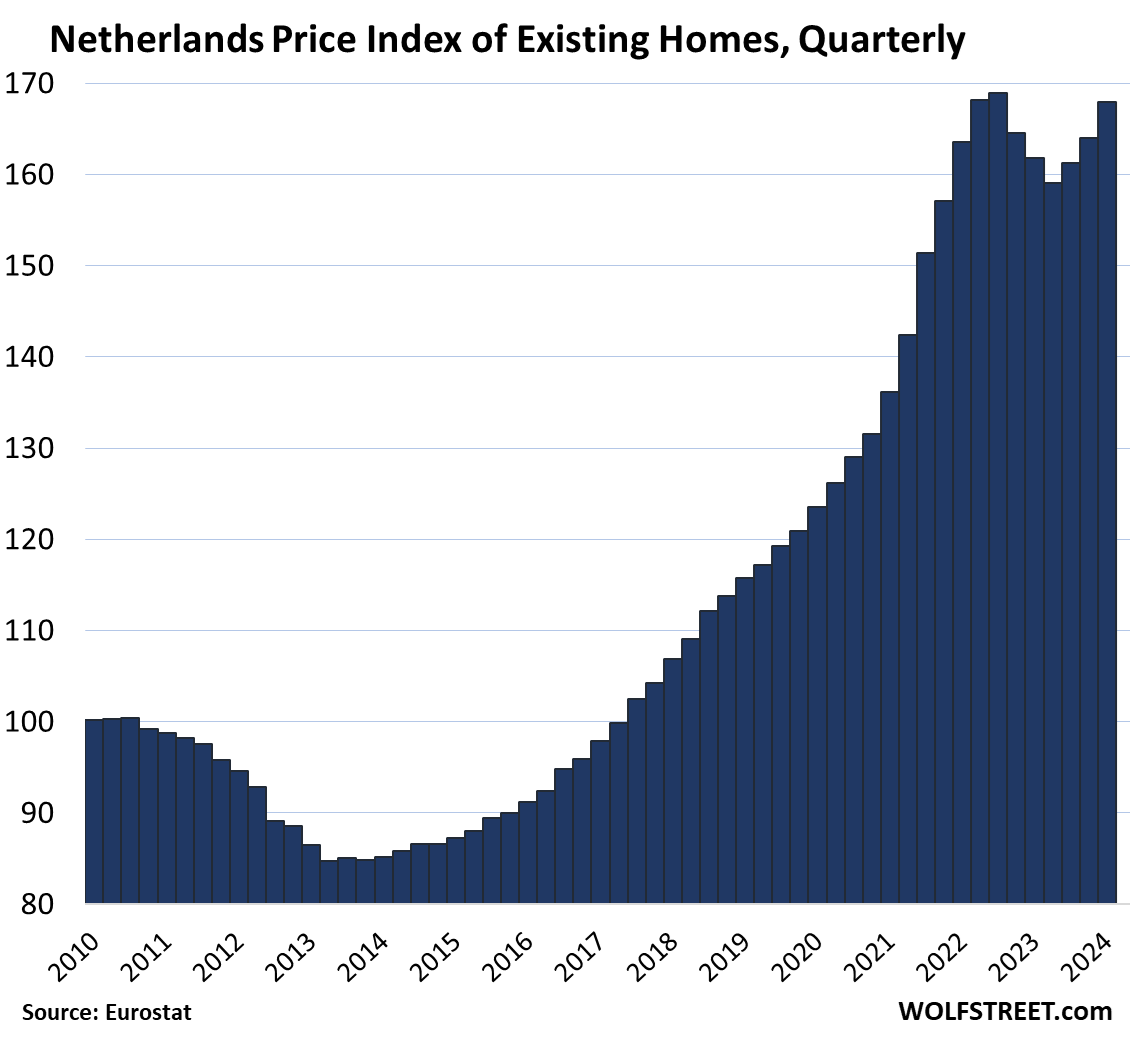
| Netherlands, Prices of Existing Homes | |||
| 2010 to Peak | QoQ | YoY | From peak |
| 68.7% | 2.4% | 3.8% | -0.6% |
| Ireland, Prices of Existing Homes | |||
| 2010 to Peak | QoQ | YoY | From peak |
| 62.5% | 2.6% | 5.7% | New high |
| Denmark, Prices of Existing Homes | |||
| 2010 to Peak | QoQ | YoY | From peak |
| 61.5% | -2.5% | 1.2% | -5.8% |
| Belgium, Prices of Existing Homes | |||
| 2010 to Peak | QoQ | YoY | From peak |
| 52.9% | 0.4% | 2.3% | New high |
| France, Prices of Existing Homes | |||
| 2010 to Peak | QoQ | YoY | From peak |
| 39.0% | -2.3% | -5.2% | -6.8% |
| Romania, Prices of Existing Homes | |||
| 2010 to Peak | QoQ | YoY | From peak |
| 17.5% | 0.8% | 2.2% | New high |
| Finland, Prices of Existing Homes | |||
| 2010 to Peak | QoQ | YoY | From peak |
| 16.9% | -2.2% | -5.4% | -12.6% |
| Spain, Prices of Existing Homes | |||
| 2010 to Peak | QoQ | YoY | From peak |
| 5.7% | 2.2% | 5.8% | New high |
| Italy, Prices of Existing Homes | |||
| since 2011 peak | QoQ | YoY | |
| -18.3% | 0.24% | 0.7% | |
This was the inaugural post of a new quarterly series, The Most Splendid Housing Bubbles in Europe. It complements our two long-running very popular series, The Most Splendid Housing Bubbles in America and The Most Splendid Housing Bubbles in Canada
Enjoy reading WOLF STREET and want to support it? You can donate. I appreciate it immensely. Click on the beer and iced-tea mug to find out how:

Would you like to be notified via email when WOLF STREET publishes a new article? Sign up here.
![]()