In 2019, the tourism industries employed over 12.5 million people in the EU
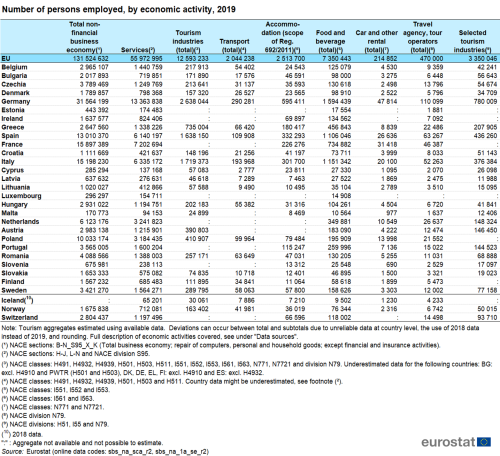
Economic activities related to tourism (but not necessarily relying only on tourism — see the section “Data sources” for further details) employed over 12.5 million people in the European Union (see Table 1). Nearly 7.4 million of these people worked in the food and beverage industry, while 2 million were employed in transport. The accommodation sector (not including real estate) accounted for more than 2.5 million jobs in the EU; travel agencies and tour operators accounted for nearly half a million. The three industries that rely almost entirely on tourism (accommodation, travel agencies/tour operators, air transport) employed nearly 3.4 million people in the EU. These three industries will from now on be referred to as the “selected tourism industries”.
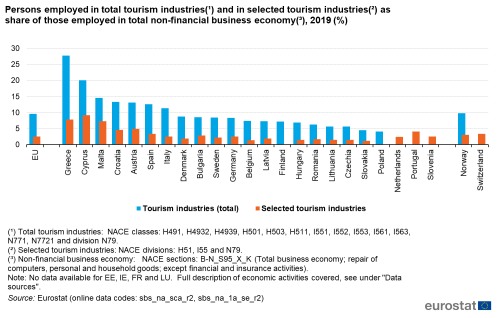
In 2019 the tourism industries accounted for more than 22 % of people employed in the services sector. When looking at the total non-financial business economy, the tourism industries accounted for nearly 10 % of people employed. Among the Member States, Greece recorded the highest share (27.8 % or more than one in four people employed) followed by Cyprus and Malta with respectively one in five and more than one in seven people employed working in the tourism sector (see Figure 1).
In absolute terms, Germany had the highest employment in the tourism industries (2.6 million people, not including passenger rail transport interurban), followed by Italy (1.7 million) and Spain (1.6 million, not including taxi operation). These three Member States accounted for nearly half (48 %) of employment in the tourism industries across the EU.
Source: Eurostat (sbs_na_sca_r2), (sbs_na_1a_se_r2)
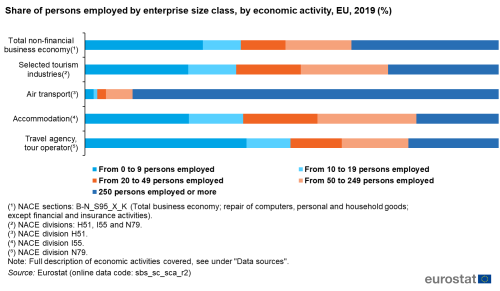
In 2019, one out of four (25 %) people employed in the selected tourism industries, worked in micro-enterprises that employ fewer than 10 people. This share is by four percentage points lower than the 29 % observed for the total non-financial business economy (see Figure 2). Looking at the three selected tourism industries separately, 39 % of employment in travel agencies and tour operators was in micro-enterprises while for the accommodation sector this figure was 25 %. Not surprisingly, small and medium-sized enterprises (
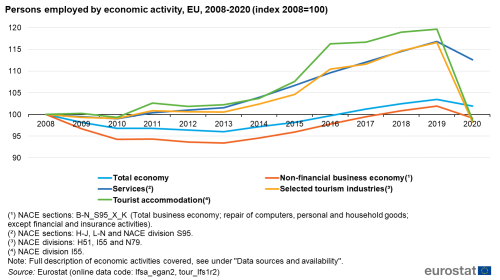
The economic crisis of 2008 led to a fall in total employment which started recovering in 2014 and reached the before crisis levels in 2016 (see Figure 3). However, this was not the case for the services sector, including the selected core tourism industries, which during the period 2008-2016 has had an average annual growth rate of +2.4 %. More specifically, during this period, the selected tourism industries registered an average annual growth of +2.0 %, while the average growth for the tourist accommodation sector was +3.8 %. This shows the tourism industry’s potential as a growth sector, even in times of economic turmoil that significantly affect other sectors of the economy.
The positive trend in employment in the selected core tourism industries continued until 2019 when the number of people employed in the sector reached +17 % compared with 2008.
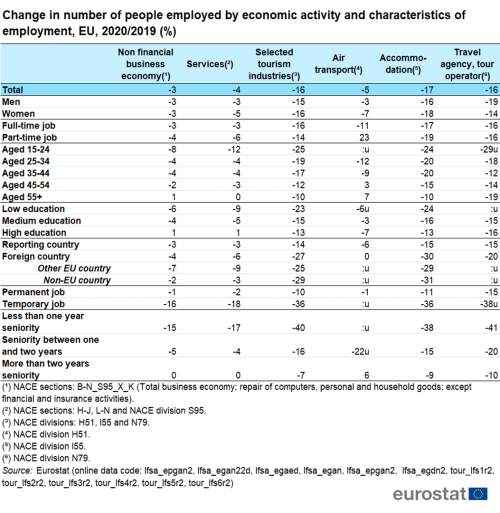
In 2020, COVID-19 pandemic has slowed economic activity and, as a result, the labour market. It clearly had a negative impact on employment but also pushed out people of unemployment by affecting their availability or their job search. Tourism was one of the most affected sectors due to the resulting travel restrictions, health protocols and the drop in demand among tourists. This was reflected to the employment in the selected tourism industries, with a sharp drop by -16 % in 2020 compared with 2019. This drop was significantly higher than the -3 % and -4 % observed for the non-financial business economy and the services sector respectively.
Characteristics of jobs in tourism industries
More detailed tables and country data are available in the excel file (see Tables 2A to 2G).
Source: Eurostat (lfsa_epgan2), (lfsa_egan22d), (lfsa_egaed), (lfsa_egan), (lfsa_egdn2), (tour_lfs1r2), (tour_lfs2r2), (tour_lfs3r2), (tour_lfs4r2), (tour_lfs5r2), (tour_lfs6r2).
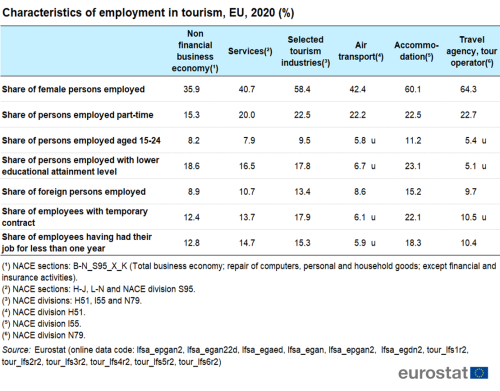
2020 was a special year due to the outbreak of the COVID-19 pandemic. The measures taken to contain the virus caused a severe economic recession. There was a hiring freeze in almost all the sectors with tourism being one of the most affected. People with less formal education, young people, people on temporary contracts or foreign workers were more likely to lose their job or have difficulties finding a job in tourism (see Table 3).
More detailed tables and country data are available in the excel file (see Tables 2A to 2G).
Source: Eurostat (lfsa_epgan2), (lfsa_egan22d), (lfsa_egaed), (lfsa_egan), (lfsa_egdn2), (tour_lfs1r2), (tour_lfs2r2), (tour_lfs3r2), (tour_lfs4r2), (tour_lfs5r2), (tour_lfs6r2).
Tourism creates jobs for women
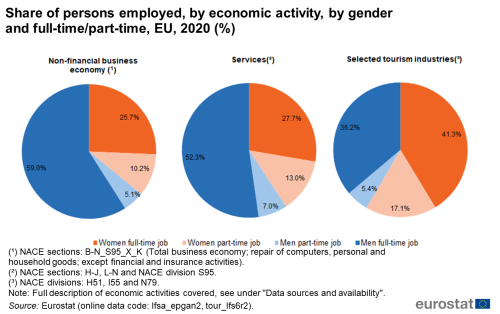
The tourism industry is a major employer of women (see Table 2, Figure 4 and Table 2A in the excel file). In 2020, compared with the total non-financial business economy where 36 % of people employed were female, the labour force of the tourism industries included more female workers (58 %) than male workers. The highest proportions were seen in travel agencies and tour operators (64 %), followed by the accommodation sector (60 %). Even though nearly three out of ten women working in the tourism industries worked part-time (compared with just over one in ten men), women working full-time still represented the biggest share of employment (41 %, see Figure 4). Female employment accounted for less than half of tourism industry employment in only two Member States (Luxembourg and Malta); for the accommodation sector this was the case only for Malta. In Estonia, Latvia, Romania and Slovakia, more than two out of three people employed in tourism were women.
Source: Eurostat (lfsa_epgan2), (tour_lfs6r2).
Part-time employment significantly higher in the tourism industries
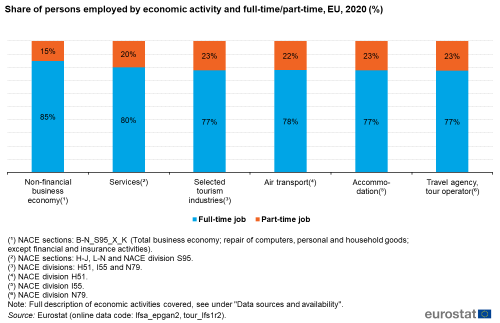
In 2020, the proportion of part-time employment in the tourism industries (23 %) was significantly higher than in the total non-financial business economy (15 %) and was comparable to the figure for the services sector as a whole (20 %) (see Table 2, Figures 4 and 5, and Table 2B in the excel file). Within the three selected tourism industries, the proportion of part-time employment in the accommodation sector and in travel agencies and tour operators was 23 %, while in air transport 22 % of staff worked on a part-time basis. In most Member States for which data is available, the tourism industries had a higher proportion of part-time employment than the rest of the economy. This was not the case for the popular tourism destinations of Greece, Spain and Cyprus where the proportion of part-time work in the tourism industries was equal or lower than in the rest of the economy. In Slovenia, the proportion of part-time workers in tourism was more than double compared to the economy as a whole.
Source: Eurostat (lfsa_epgan2), (tour_lfs1r2).
Tourism attracts a young labour force
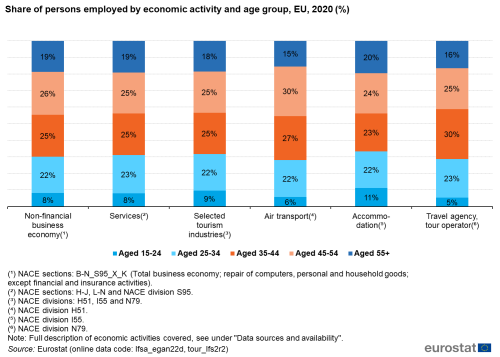
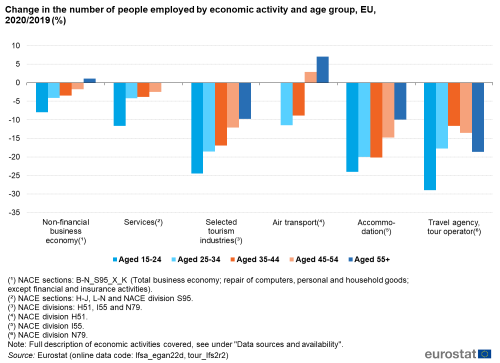
Traditionally, the tourism industries have a particularly young labour force, as these industries can make it easy to enter the job market. In 2020 however, the COVID-19 crisis has affected labour market of young people aged 15-24 more than the other age groups. With a drop of -25 % compared with 2019, the impact on youth employment in the selected tourism industries was even harder than the impact on this age group in the rest of the non-financial business economy where the drop was -8 % (see Table 3 and Figure 6).
Source: Eurostat (lfsa_egan22d), (tour_lfs2r2).
The share of young workers in the selected tourism industries remained however high in 2020, with close to one in ten people (9.5 %) aged 15 to 24, while only 8.2 % of the labour force in the non-financial business economy were young workers. In the big majority of EU countries with available data, the share of young workers in tourism industries was above the proportion seen in the economy as a whole. The highest proportions of employed people aged 15 to 24 were registered in Denmark (21 %), Ireland and the Netherlands (both at 19 %) (see Table 2 and Table 2C in the excel file). In the subsector of accommodation, 11 % of the people employed were between 15 and 24 years old (see Figure 6a), while in the three above mentioned countries, at least 23 % of persons employed in this sector were aged 15 to 24.
The tourist accommodation sector gives more opportunities to lower educated workers
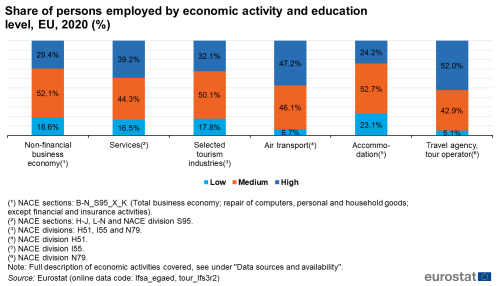
The previous sections showed that tourism employs more female workers and young workers. In 2020, people with a lower educational level (those who have not finished upper secondary schooling) were more or less equally represented on the labour market as a whole and in the tourism sector (respectively 19 % and 18 %) — see Table 2, Figure 7 and Table 2D in the excel file. However, in the subsector of accommodation, 23 % of people employed had a lower educational level. In Malta and Portugal at least two out of five people employed in tourist accommodation belong to this group. However in these two countries lower educated people are more represented in the whole labour force compared with the rest of EU countries.
Source: Eurostat (lfsa_egaed), (tour_lfs3r2).
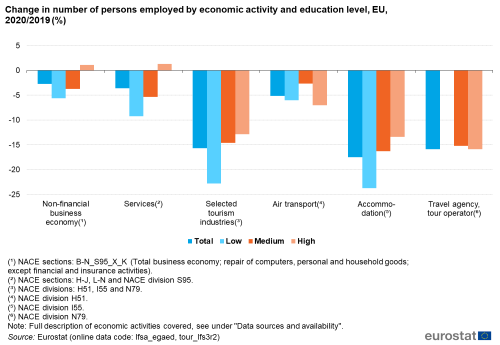
In 2020, however, as in the case of youth employment, people with a lower educational level were hit the hardest from the COVID-19 impact on employment. The drop in the employment in the selected tourism industries was -23 % for this group of workers, while it was -6 % in the non-financial business economy (see Table 3 and Figure 7a).
Source: Eurostat (lfsa_egaed), (tour_lfs3r2).
Nearly one in seven people employed in tourism are foreign citizens
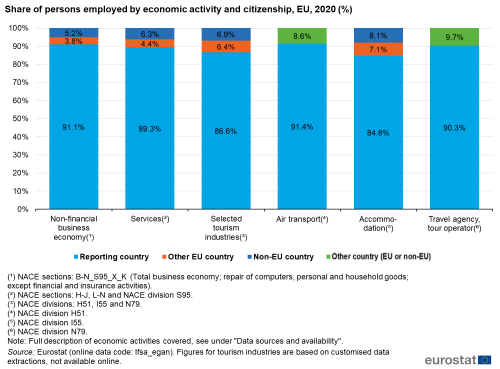
Many foreign citizens work in tourism-related industries (see Table 2, Figure 8 and and Table 2E in the excel file). In 2020, they accounted for 13 % of the labour force in tourism industries (of which 6 % were from other EU Member States and 7 % were from non-EU countries). In the services sector as a whole, the proportion of foreign citizens employed was 11 %, and in the total non-financial business economy it was 9 %. Looking at this in more detail, we see that foreign workers made up 9 % of the workforce in air transport and 10 % in travel agencies or tour operators, but 15% of the workforce in accommodation (i.e. more than one in seven people employed in this sub-sector was a foreign citizen).
In three EU Member States, more than one in three people employed in the selected tourism industries were foreign citizens: Cyprus (34 %), Luxembourg (58 %) and Malta (40 %).
Source: Eurostat (lfsa_egan). Figures for tourism industries are based on customised data extractions, not available online.
In 2020 compared with 2019, the drop in the number of foreign workers was more significant in the selected tourism industries (-27 %, reaching -30 % in the segment of foreign citizens employed in the accommodation sector) than in the non-financial business economy (-4 %) (see Table 3).
Jobs are less stable in tourism than in the rest of the economy
Since tourism tends to attract a young labour force, often at the start of their professional life (see above, Table 2 and Figure 6), certain key characteristics of employment in this sector are slightly less advantageous than in other sectors of the economy.
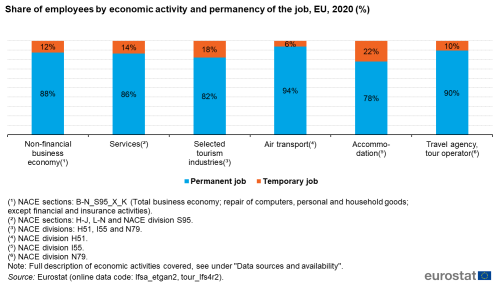
The likelihood of occupying a temporary job was significantly higher in tourism than in the total non-financial business economy (18% versus 12 % of people employed) – see Table 2, Figure 9 and Table 2F in the excel file. There are big differences across the European Union (ranging from less than 3 % of temporary contracts in tourism in Estonia, Lithuania and Romania to more than 30 % in Greece, Italy, Cyprus and Poland). In all but five countries (Estonia, Spain, Lithuania, Hungary and Malta), fewer people have a permanent job in tourism than in the economy on average. In Bulgaria, Greece and Cyprus, the proportion of temporary workers was three to four times higher in tourism than in the non-financial business economy as a whole. In the accommodation sector, more than one in five people employed did not have a permanent contract.
In 2020 compared with 2019 however, the drop in the number of people working with a temporary contract was -36 % in the selected tourism industries, significantly higher than the drop in the total non-financial business economy where it was -16 % (see Table 3).
Source: Eurostat (lfsa_etgan2), (tour_lfs4r2).
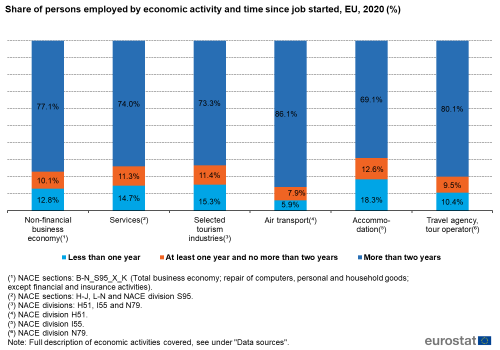
Similarly, the likelihood of an employee holding their current job for less than one year (see Table 2, Figure 10 and Table 2G in the excel file) was also higher in tourism than in the non-financial business economy as a whole (15 % versus 13 %). In the economy on average, more than three out of four employees (77 %) had worked with the same employer for two years or more, while in tourism this is the case for 73 % of people employed. Air transport tends to offer more stable jobs, with only 6 % of employees having job seniority of less than one year, compared with 18 % in accommodation and 10 % for people employed by travel agencies or tour operators. More than one third of the workforce in the accommodation sector had held their job for less than one year in Greece and Cyprus.
Source: Eurostat (lfsa_egdn2), (tour_lfs5r2).
However, as seen in the previous sections, employment in tourism was seriously affected by the outbreak of the COVID-19 pandemic. Compared with 2019, the drop in the number of people working with a temporary contract was -36 % in the selected tourism industries while in the non-financial business economy this was -16 % (see Table 3).
Regional issues in tourism activities
Regions with high tourist activity tend to have lower unemployment rates
Tourist activity can have a negative impact on the quality of life of the local population in popular tourist areas. However, the influx of tourists can also boost the local economy and labour market.
Comparing regional data on tourism intensity (e.g. the annual number of nights spent by tourists per capita of local population) with regional unemployment rates or their deviation from the national average unemployment rate, we see that in 2019, 22 of the 30 regions with the highest tourism intensity had an unemployment rate below the national average.
Table 4 lists the regions with a tourism intensity over 20 (tourism nights per local inhabitant). In all but three of these 20 regions, the unemployment rate lied below the national average. Two of the three regions where this did not hold true, the Canary Islands and Madeira, are island regions relatively remote from the mainland (and the mainland’s economy).
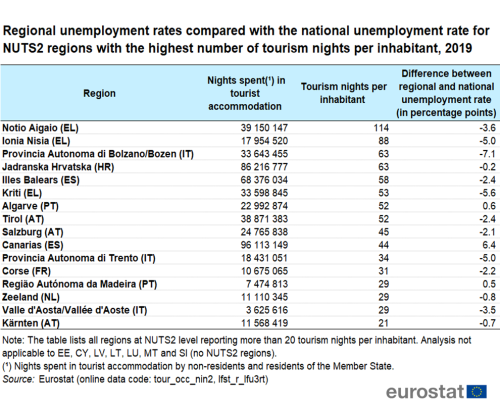
Source: Eurostat (tour_occ_nin2), (lfst_r_lfu3rt)
Earnings and labour costs in the tourism industries
Hourly earnings and labour costs in the accommodation sub-sector are below the average for the economy as a whole
Besides employment rates, another important feature of labour market analysis concerns labour costs for employers and earnings for employees. This section takes a look at hourly labour costs and hourly gross earnings, both in the economy as a whole and in the selected tourism industries.
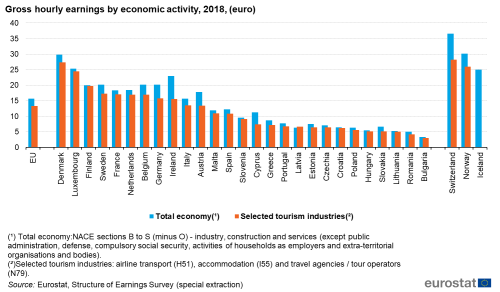
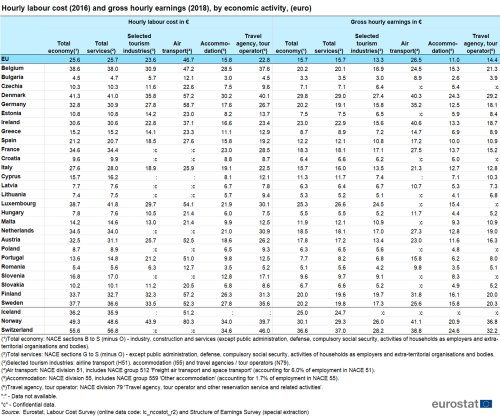
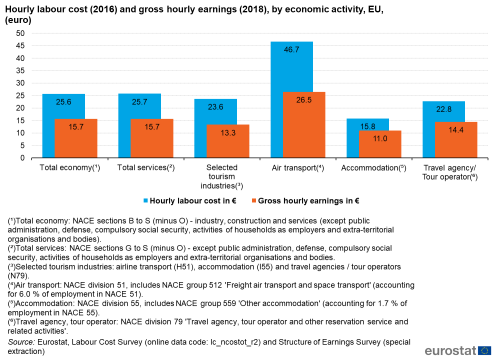
In the EU as a whole, labour costs and earnings tend to be significantly lower in the tourism industries than they are in the total economy. In the economy, the average hourly labour cost was €25.6 in 2016 and average hourly earnings were €15.7 in 2018. In the three selected tourism industries (air transport, accommodation, travel agencies & tour operators) the average hourly labour cost was €23.6 in 2016 and the average gross hourly earnings amounted to €13.3 in 2018 (see Table 5 and Figure 11).
Source: Eurostat, Labour Cost Survey (lc_ncostot_r2) and Structure of Earnings Survey (special extraction)
Source: Eurostat, Labour Cost Survey (lc_ncostot_r2) and Structure of Earnings Survey (special extraction)
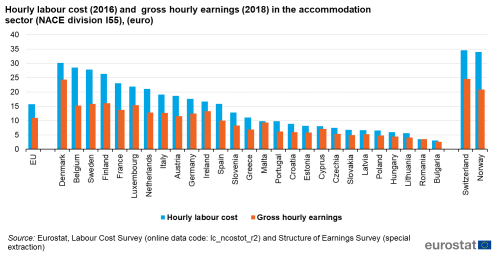
Given the characteristics of tourism jobs outlined above, this observation does not come as a surprise: a relatively young labour force (see Figure 6a) with a higher proportion of temporary contracts (see Figure 9) and lower job seniority (see Figure 10) has a comparative disadvantage on the labour market, which leads to lower labour costs and earnings. For the accommodation sector — which employs more people with a lower educational level and more part-timers — the differences are even higher. In 2018, for people employed in the accommodation sub-sector, gross hourly earnings were €11.0. For air transport, they were €26.5 (well above the average for the economy as a whole), and for travel agencies and tour operators they were €14.4.
Gross hourly earnings in tourism were highest in Denmark, Luxembourg, Norway and Switzerland, but these countries were also among the top ten countries with highest average hourly earnings in the total economy (see Table 5 and Figure 12).
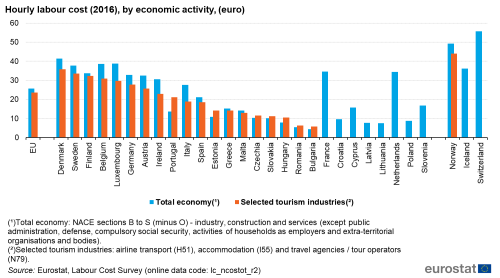
In 2016 only seven EU Member States had higher hourly labour costs in tourism than the total economy: Bulgaria, Czechia, Estonia, Hungary, Portugal, Romania and Slovakia (see Table 5 and Figure 13); for gross hourly earnings, this was the case only for Latvia. Comparing the accommodation subsector with the economy as a whole, both hourly average labour costs and earnings were lower for those employed in accommodation, and this was true across the EU (see Figure 14).
Source: Eurostat, Labour Cost Survey (lc_ncostot_r2)
Source: Eurostat, Labour Cost Survey (lc_ncostot_r2) and Structure of Earnings Survey (special extraction)
Source data for tables and graphs
Data sources
This article includes data from four different sources:
This data is available at a detailed level of economic activity, which makes it possible to identify and select industries that are part of the tourism sector.
For Eurostat, tourism industries (total) include the following NACE Rev.2 classes:
- H4910 — Passenger rail transport, interurban
- H4932 — Taxi operation
- H4939 — Other passenger land transport n.e.c
- H5010 — Sea and coastal passenger water transport
- H5030 — Inland passenger water transport
- H5110 — Passenger air transport
- I5510 — Hotels and similar accommodation
- I5520 — Holiday and other short-stay accommodation
- I5530 — Camping grounds, recreational vehicle parks and trailer parks
- I5610 — Restaurants and mobile food service activities
- I5630 — Beverage serving activities
- N7710 — Renting and leasing of motor vehicles
- N7721 — Renting and leasing of recreational and sports goods
- NACE division N79 — Travel agency, tour operator reservation service and related activities.
However, many of these activities provide services to both tourists and non-tourists – typical examples include restaurants catering to tourists but also to locals and rail transport being used by tourists as well as by commuters.
For this reason, this publication focuses on the following selected tourism industries which rely almost entirely on tourism:
- H51 — Air transport (including H512 ‘Freight air transport’ which accounts for 6.0 % of employment in H51).
- I55 — Accommodation (including I559 ‘Other accommodation’ which accounts for 1.7 % of employment in I55).
- N79 — Travel agency, tour operator reservation service and related activities (including N799 ‘Other reservation service and related activities’ which accounts for 12.9 % of employment in N79).
Context
According to a United Nations World Tourism Organisation (UNWTO) publication titled “Tourism highlights“, the EU is a major tourist destination, with four of its Member States among the world’s top 10 destinations in 2019.
Tourism has the potential to contribute towards employment and economic growth, as well as to development in rural, peripheral or less-developed areas. These characteristics drive the demand for reliable and harmonised statistics within this field, as well as within the wider context of regional policy and sustainable development policy areas.
Tourism can play a significant role in the development of European regions. Infrastructure created for tourism purposes contributes to local development, while jobs that are created or maintained can help counteract industrial or rural decline. Sustainable tourism involves the preservation and enhancement of cultural and natural heritage, ranging from the arts to local gastronomy or the preservation of biodiversity.
In 2006, the European Commission adopted a Communication titled “A renewed EU tourism policy: towards a stronger partnership for European tourism” (COM(2006) 134 final). It addressed a range of challenges that will shape tourism in the coming years, including Europe’s ageing population, growing external competition, consumer demand for more specialised tourism, and the need to develop more sustainable and environmentally-friendly tourism practices. It argued that more competitive tourism supply and sustainable destinations would help raise tourist satisfaction and secure Europe’s position as the world’s leading tourist destination. It was followed in October 2007 by another Communication, titled “Agenda for a sustainable and competitive European tourism” (COM(2007) 621 final), which proposed actions in relation to the sustainable management of destinations, the integration of sustainability concerns by businesses, and the awareness of sustainability issues among tourists.
The Lisbon Treaty acknowledged the importance of tourism — outlining a specific competence for the EU in this field and allowing for decisions to be taken by a qualified majority. An article within the Treaty specifies that the EU “shall complement the action of the Member States in the tourism sector, in particular by promoting the competitiveness of Union undertakings in that sector”. “Europe, the world’s No 1 tourist destination — a new political framework for tourism in Europe” (COM(2010) 352 final) was adopted by the European Commission in June 2010. This Communication seeks to encourage a coordinated approach for initiatives linked to tourism and defined a new framework for actions to increase the competitiveness of tourism and its capacity for sustainable growth. It proposed a number of European or multinational initiatives — including a consolidation of the socioeconomic knowledge base for tourism — aimed at achieving these objectives.

